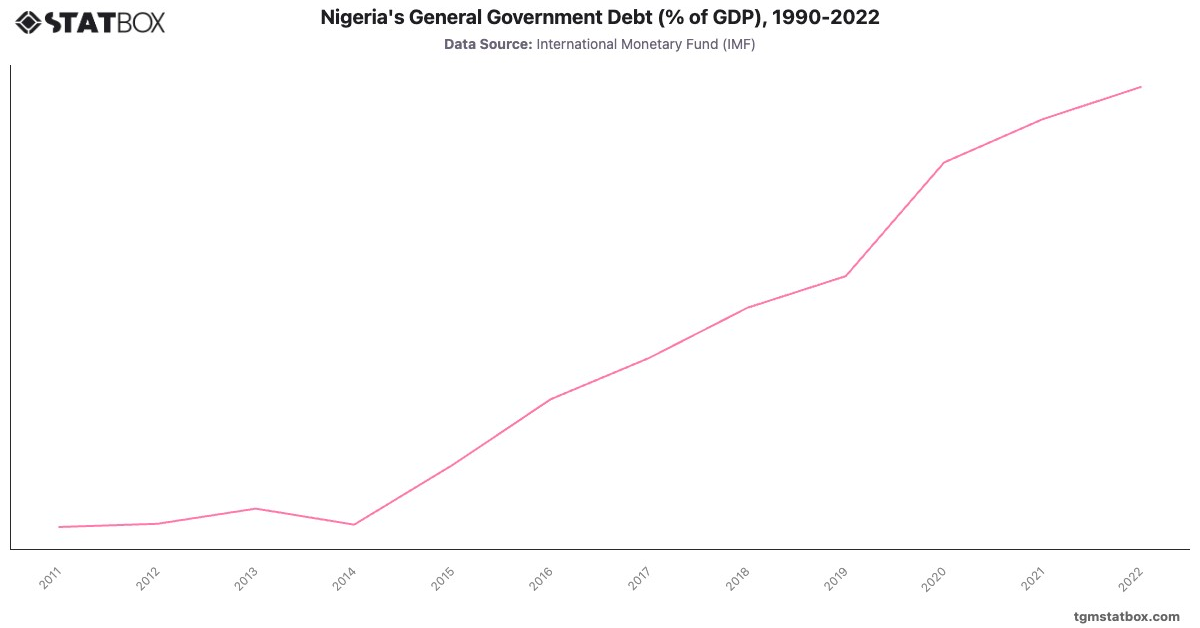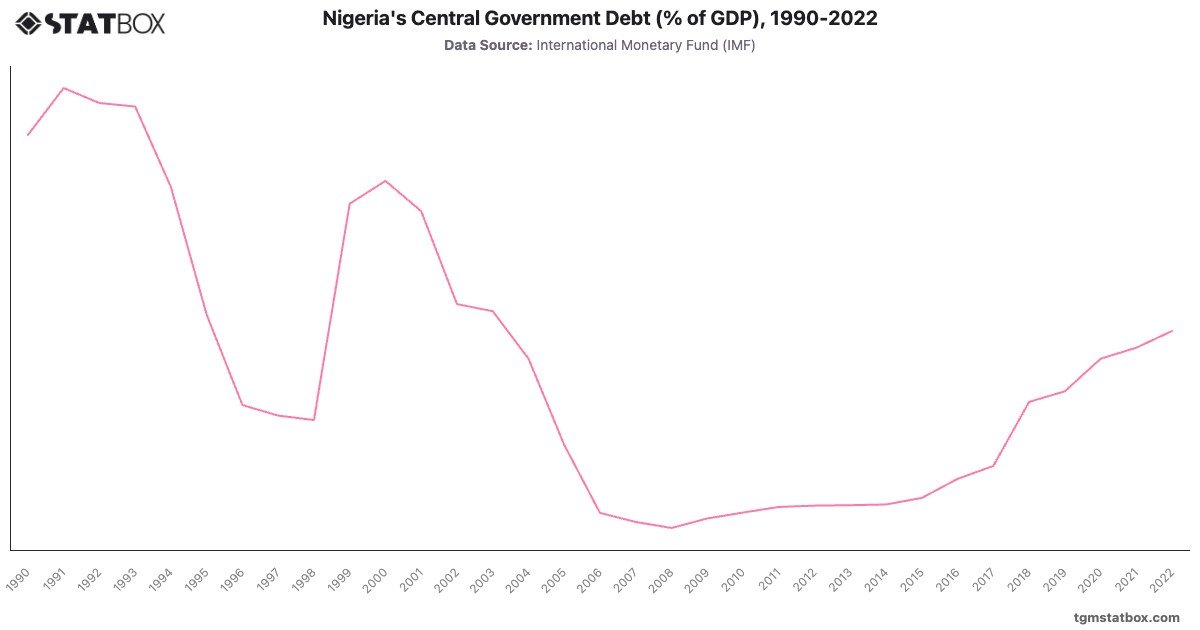
Nigeria's central government debt saw dramatic fluctuations from 1990 to 2022, reflecting economic cycles, structural reforms, and external factors. Debt initially rose from in 1990 to in 1991 but dropped sharply after 1995, reaching a low of in 2008. This decline was largely attributed to debt relief initiatives, particularly the Paris Club agreement in 2005.
Debt levels began rising again from 2010, driven by oil price volatility and increased borrowing to finance infrastructure. The debt-to-GDP ratio climbed to in 2020, exacerbated by the pandemic-induced economic slowdown, and reached by 2022 as fiscal pressures persisted despite modest economic recovery.
Debt levels began rising again from 2010, driven by oil price volatility and increased borrowing to finance infrastructure. The debt-to-GDP ratio climbed to in 2020, exacerbated by the pandemic-induced economic slowdown, and reached by 2022 as fiscal pressures persisted despite modest economic recovery.
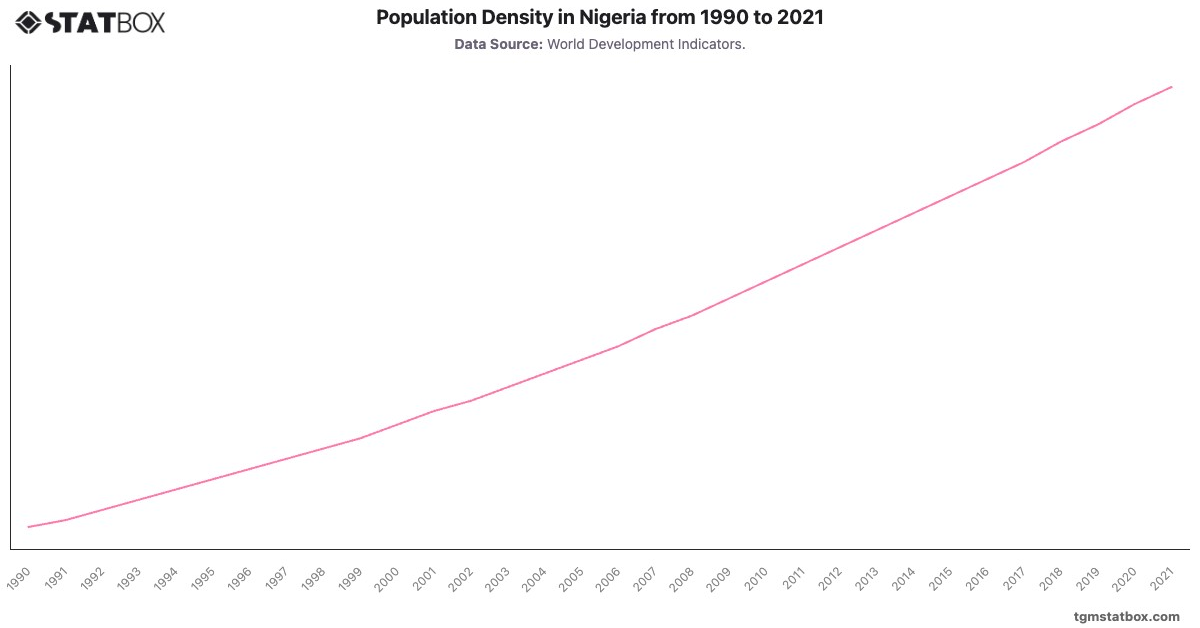
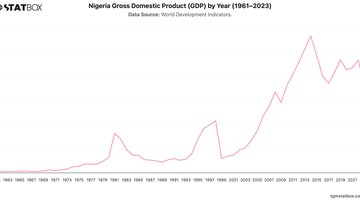
For a broader context, visit other statistics on Nigeria’s urbanization growth, Nigeria’s annual GDP, Nigeria’s population density data.