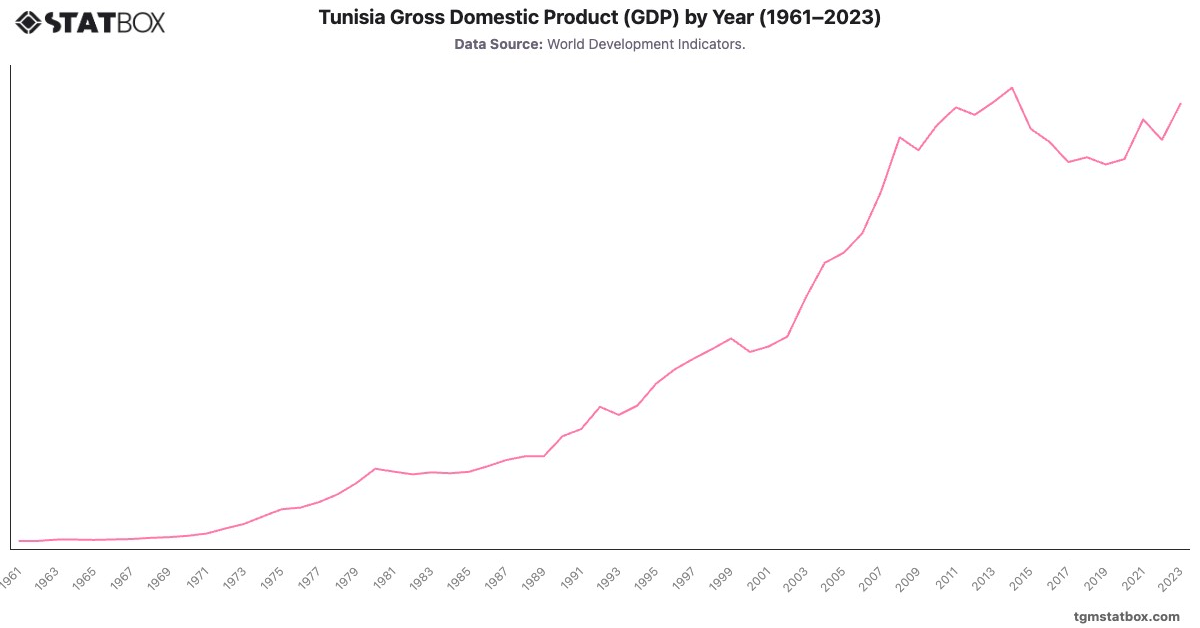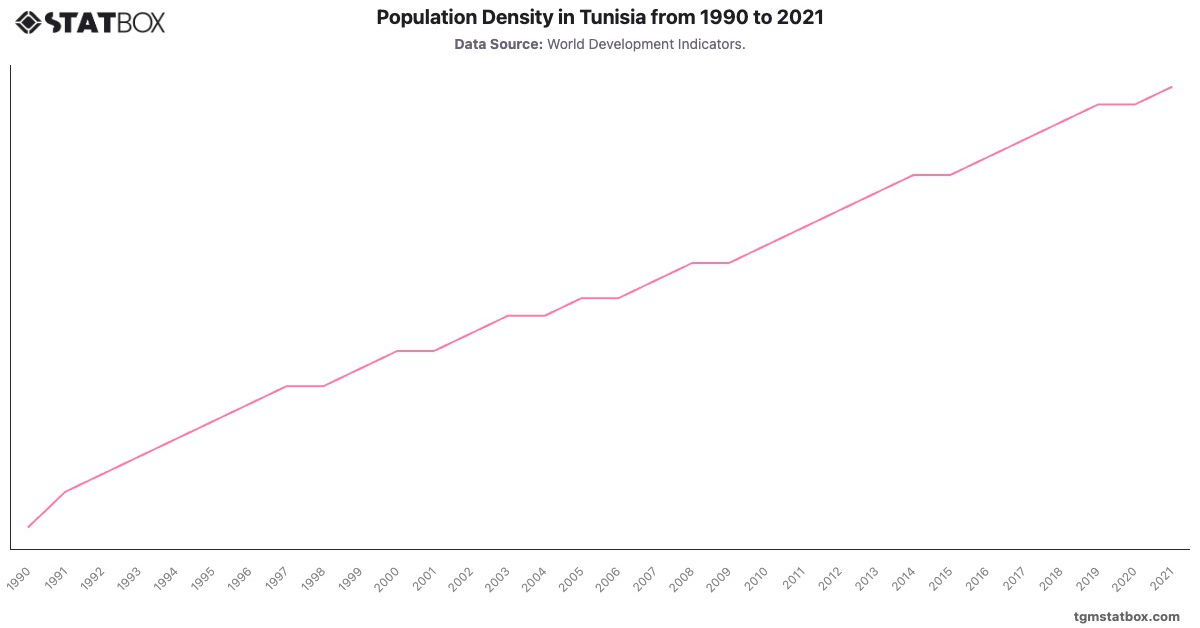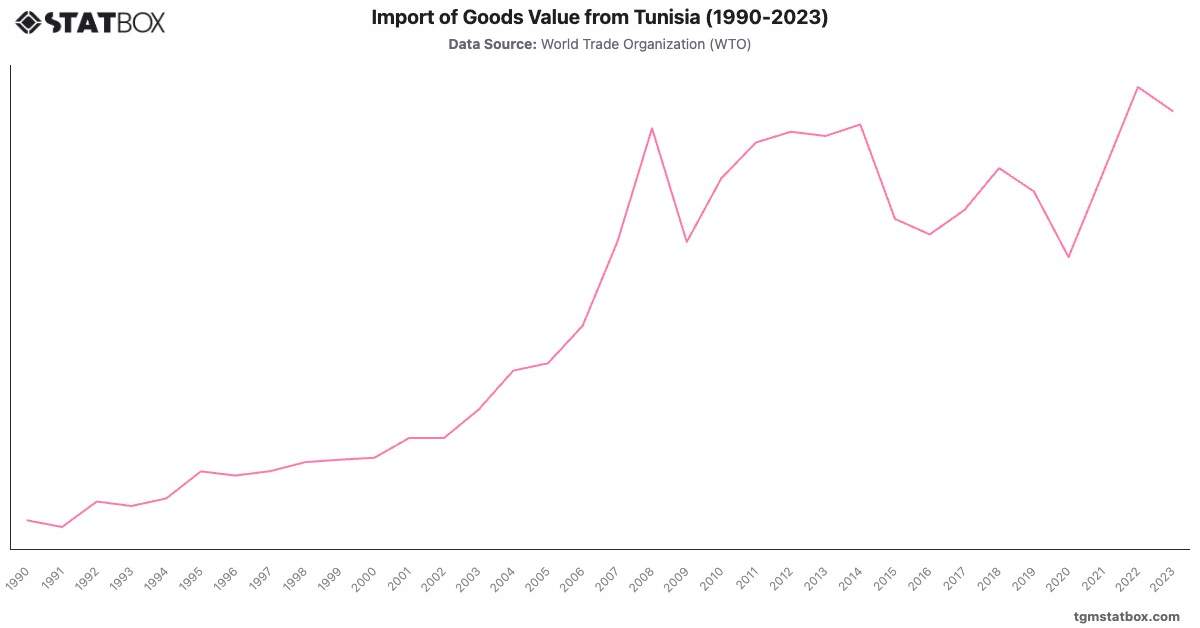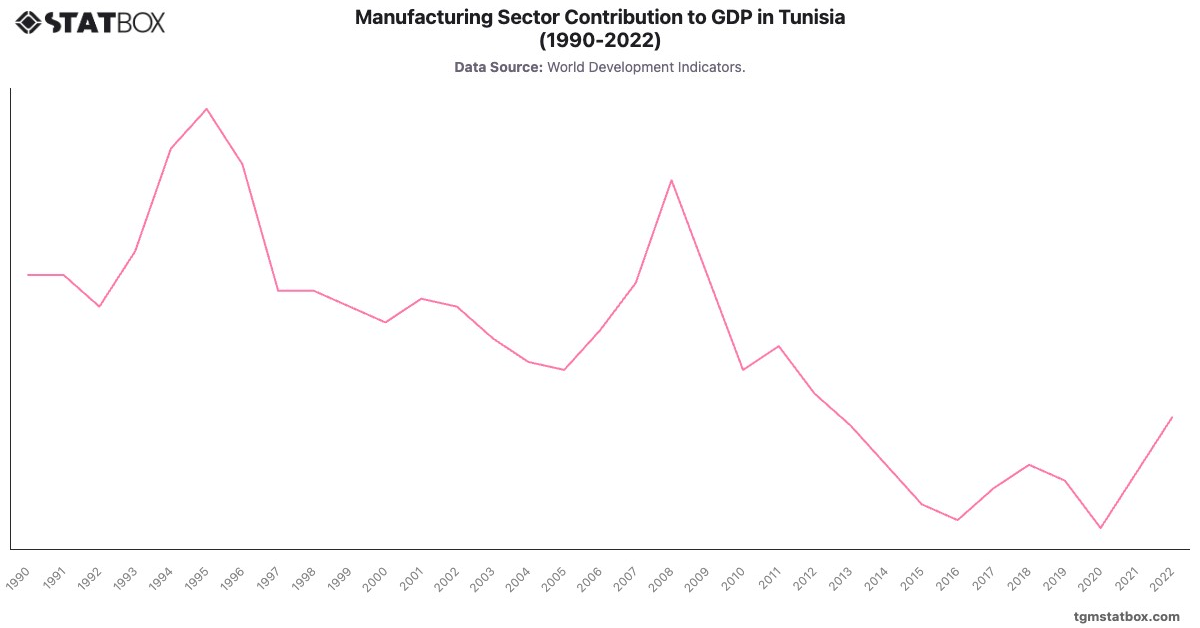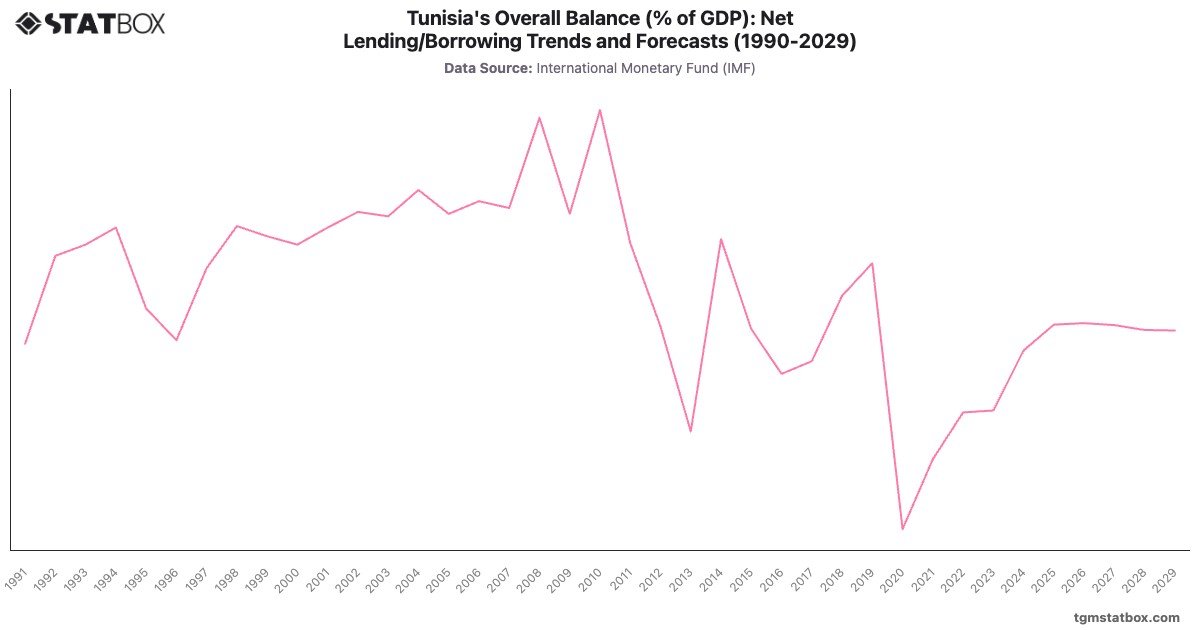
Tunisia’s fiscal history reflects economic and political challenges. Deficits were moderate in the 1990s, averaging around -. However, the Arab Spring in 2011 triggered economic disruptions, leading to deficits peaking at - in 2013.
The COVID-19 pandemic deepened the deficit to - in 2020. While recovery efforts have reduced the deficit to - in 2023, projections suggest stabilization around - by 2029, emphasizing the need for structural reforms to enhance fiscal sustainability.
The COVID-19 pandemic deepened the deficit to - in 2020. While recovery efforts have reduced the deficit to - in 2023, projections suggest stabilization around - by 2029, emphasizing the need for structural reforms to enhance fiscal sustainability.
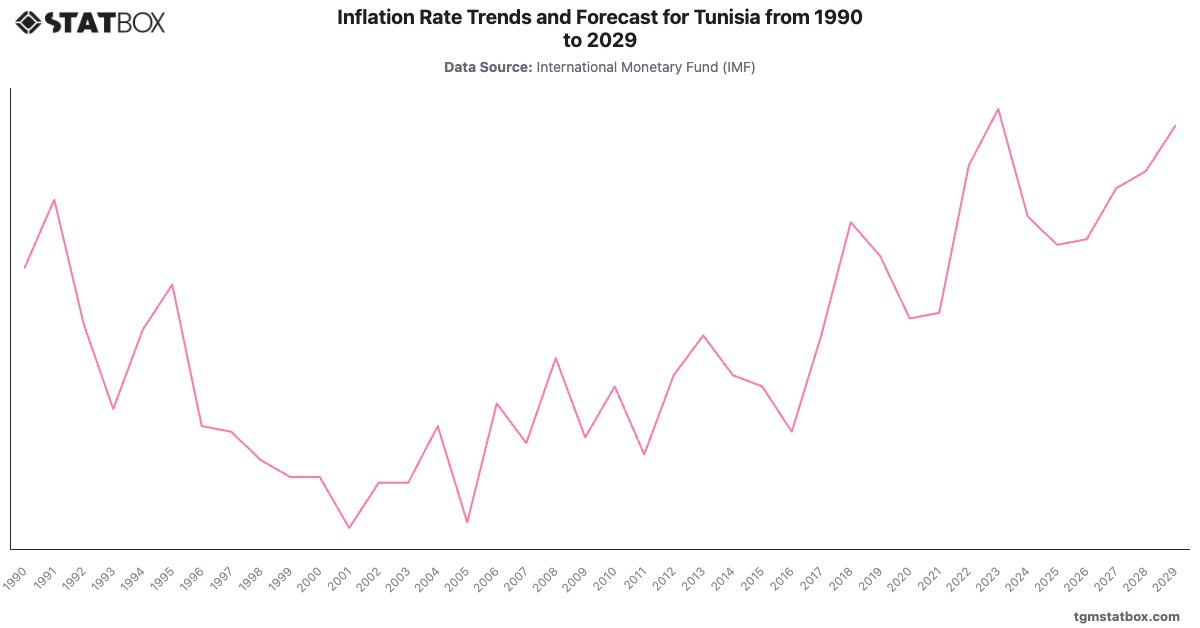
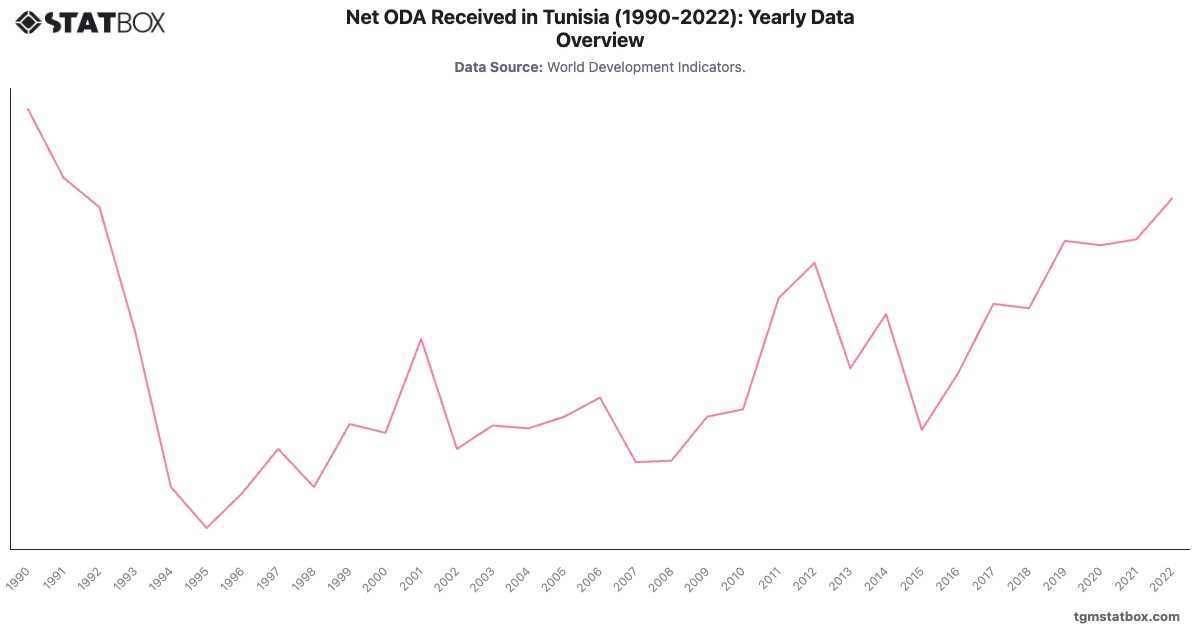
For additional information, visit statistics on Tunisia’s inflation rate trajectory, Tunisia’s annual GDP growth rate, Tunisia’s net ODA received.