United States GDP Growth Rate by Year (1961–2023)

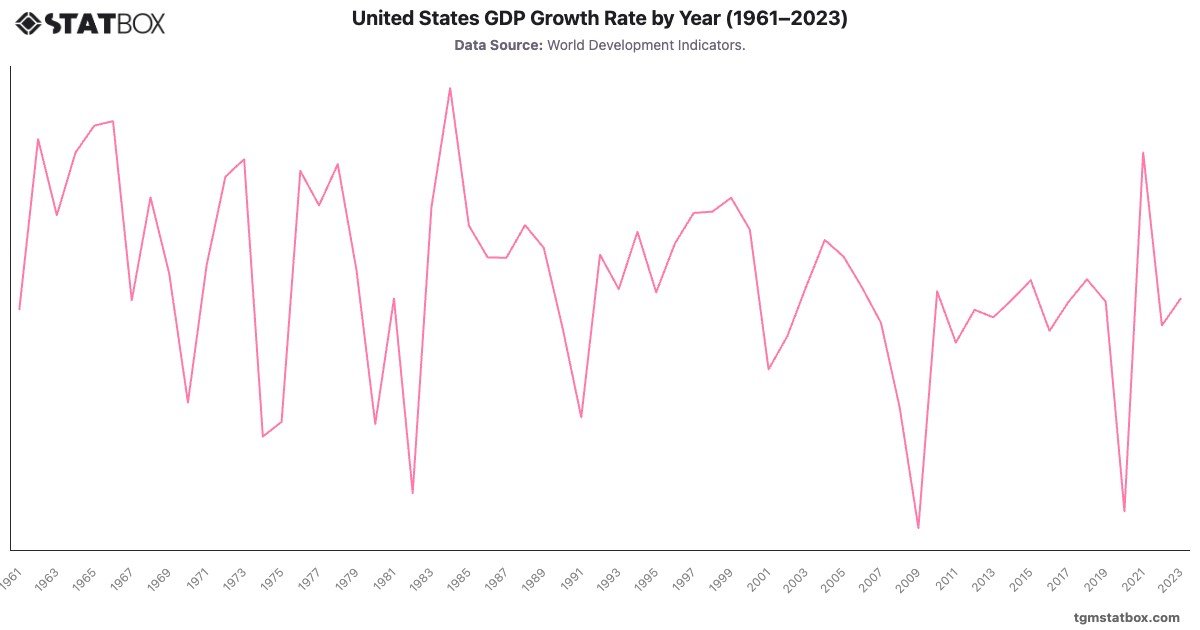
United States GDP Growth Rate by Year (1961–2023)

Unlock this statistic

Log in to unlock

No account? Sign up free

Insights

Key Takeaways

United States GDP Growth (1961-2023)

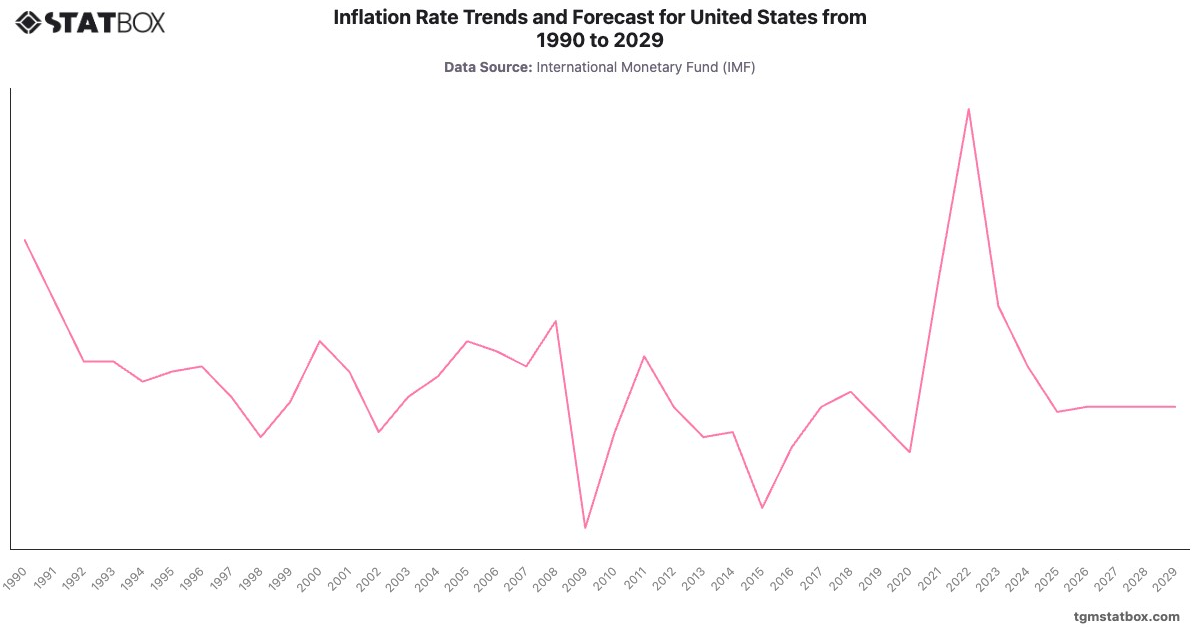
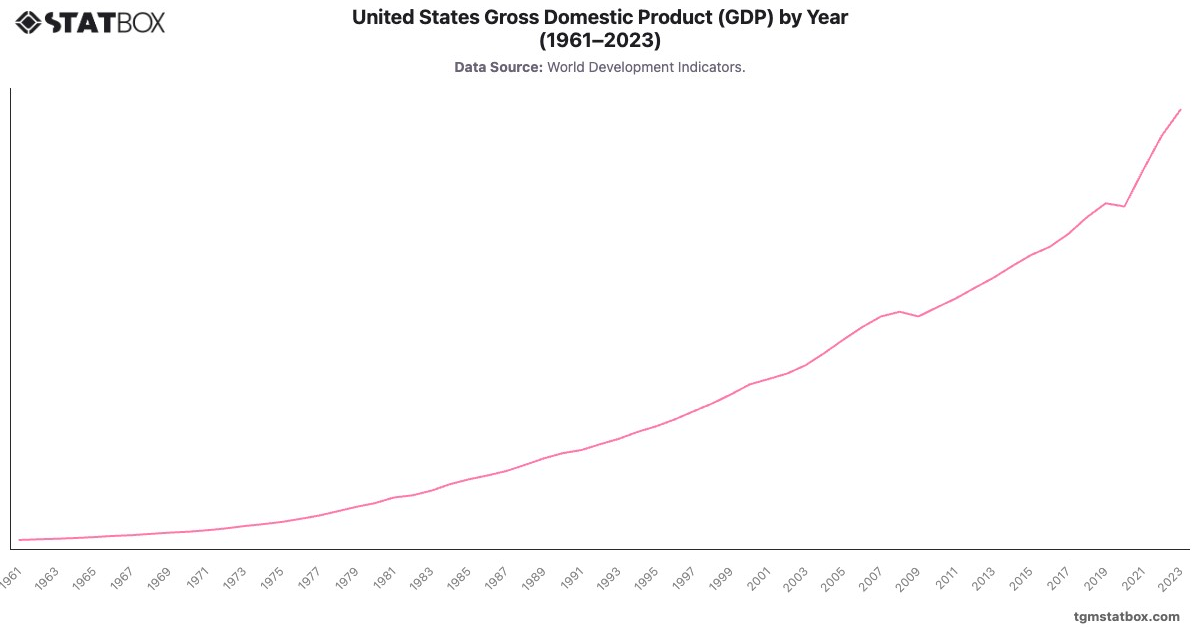
The U.S. economy has had cyclical expansions and contractions, with strong growth in the 1960s and 1980s. The 2008 financial crisis led to a - contraction in 2009, but recovery was steady through the 2010s. COVID-19 caused a - contraction in 2020, followed by a robust recovery in 2021. By 2023, growth had moderated to , driven by consumer demand but impacted by inflation and interest rate adjustments.

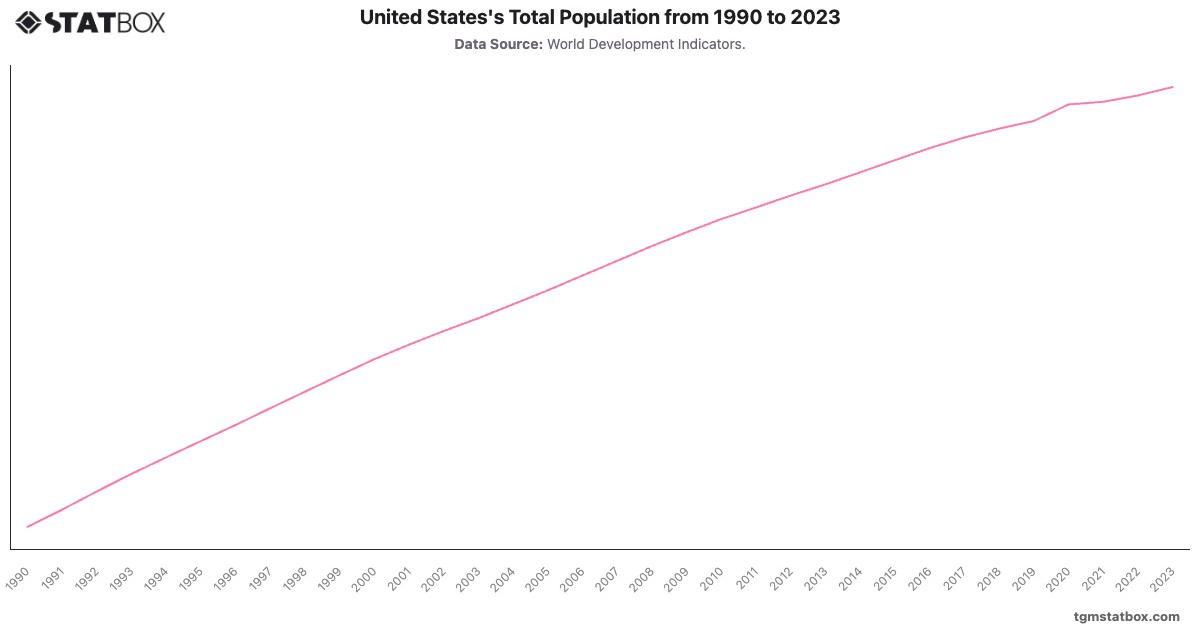
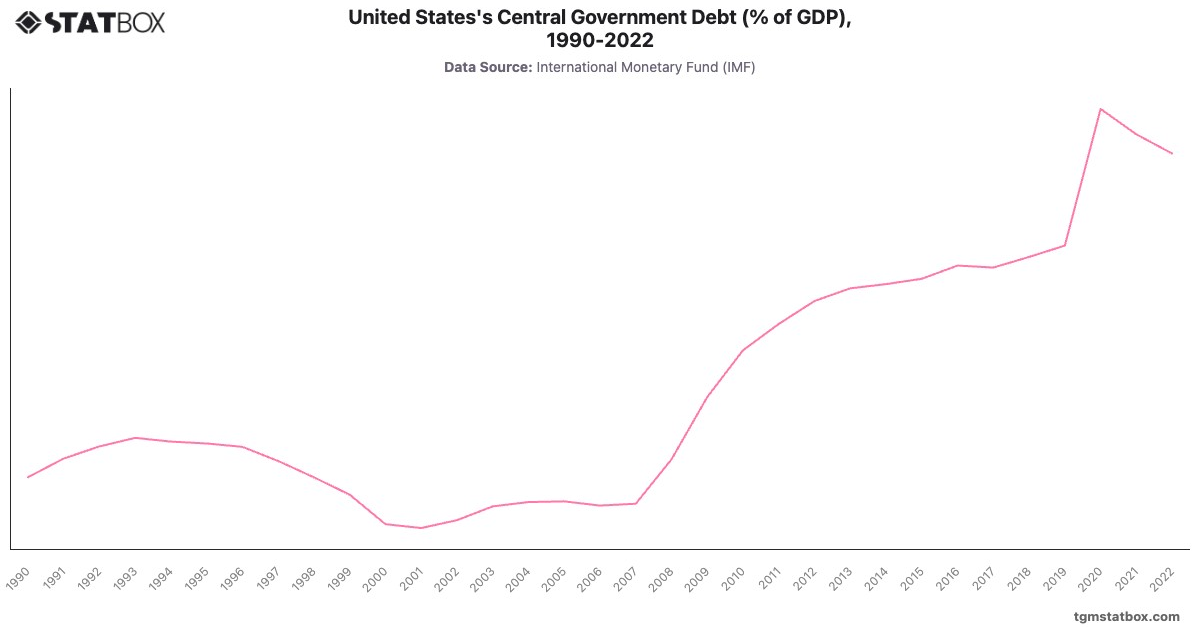
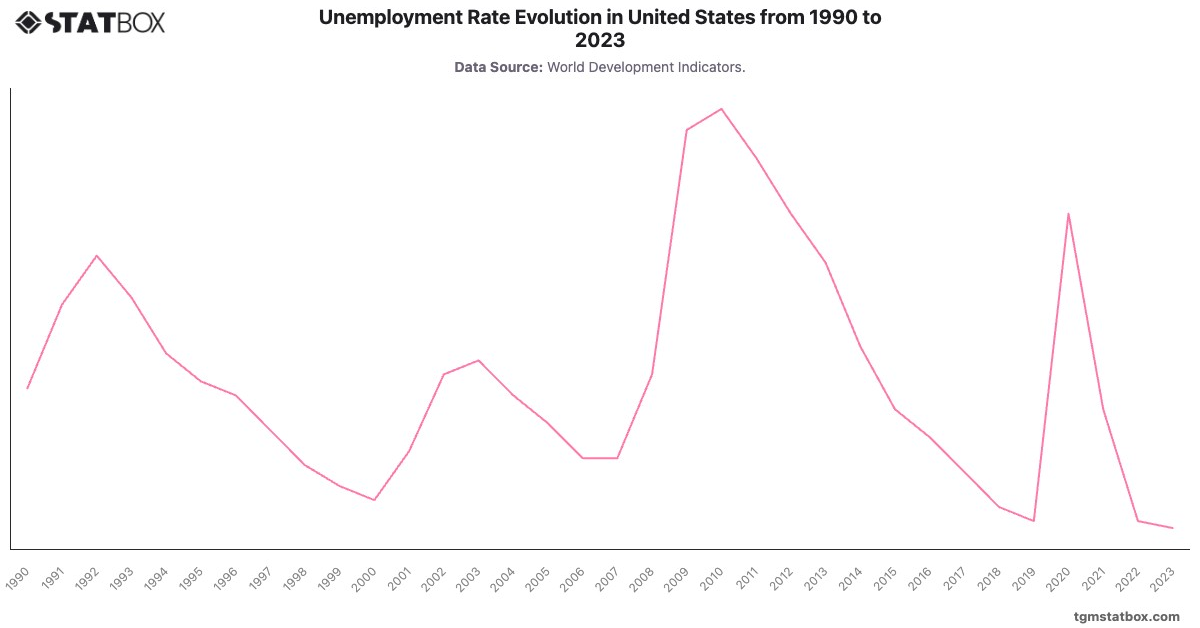
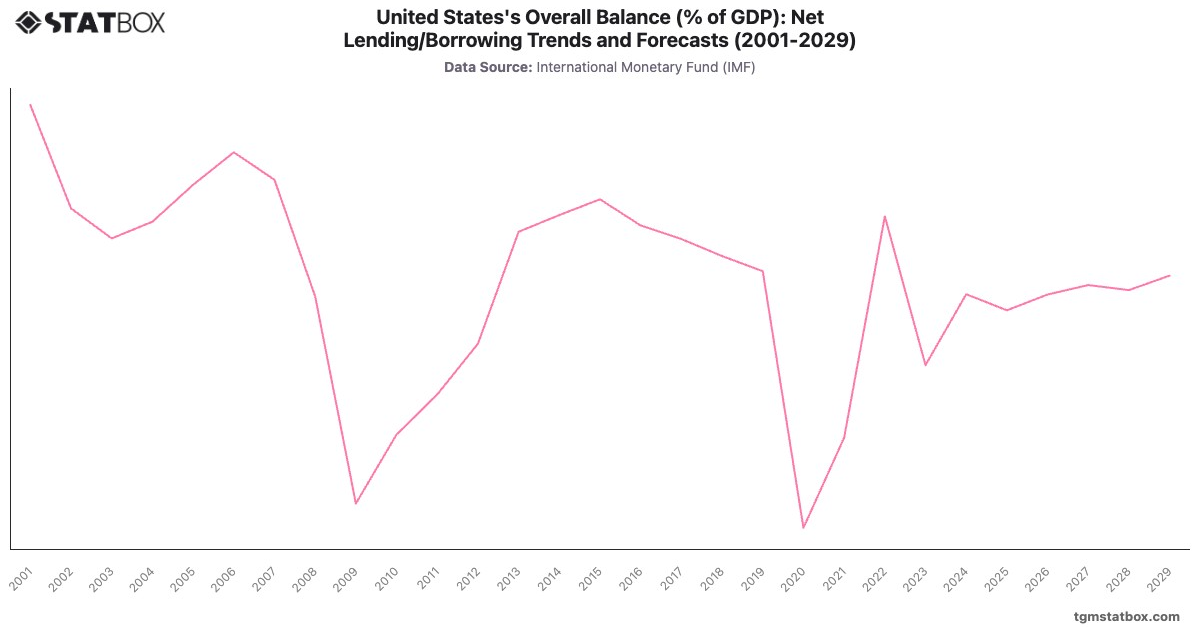
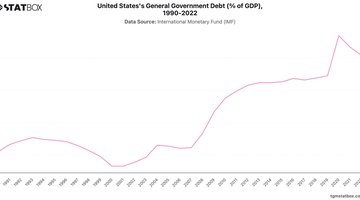
Find out more through related statistics on United States unemployment rate, US annual GDP figures, US net financial position as a percentage of GDP.

Would you like to know more?
Check our report on this topic

Sustainability Report: Insights in the U.S.

USA Sustainability Insights Report 2024

Sustainability Report: Insights in the U.S.

Discover how people in USA think and act on sustainability. TGM delivers localized, data-driven insights to support responsible business decisions and global impact.

Go to report

Further Recommended Statistics

Statbox vector
Statbox |form contact icon

Have Other Queries?

Statbox vector

Connect with our expert team for immediate assistance or comprehensive market analysis. We are always ready to support your business needs.