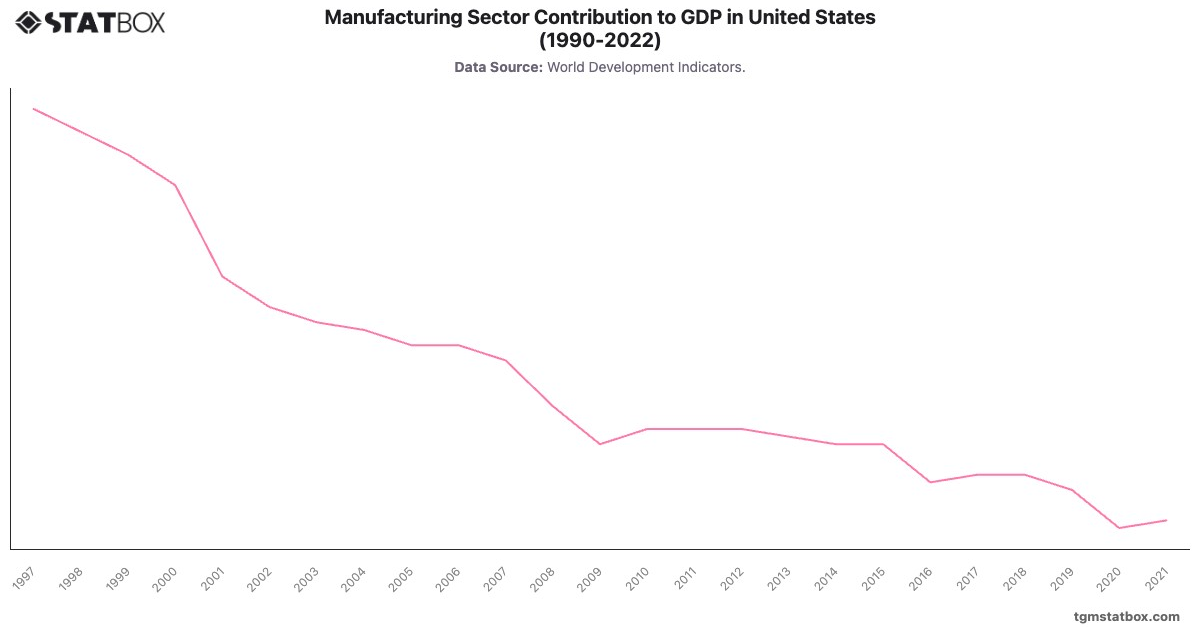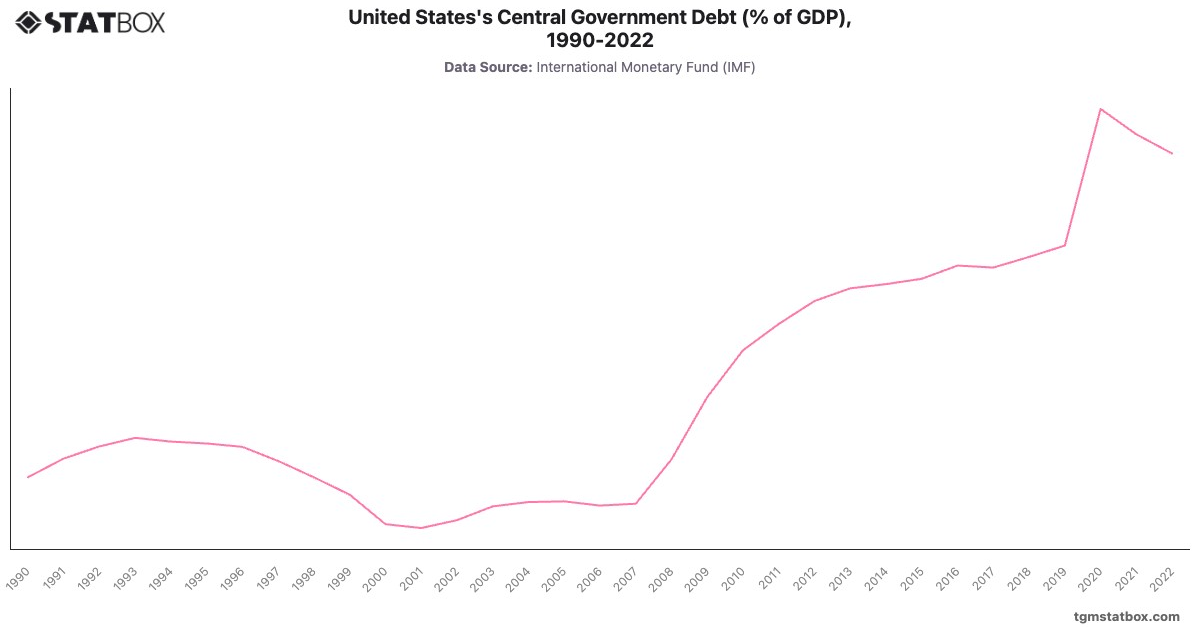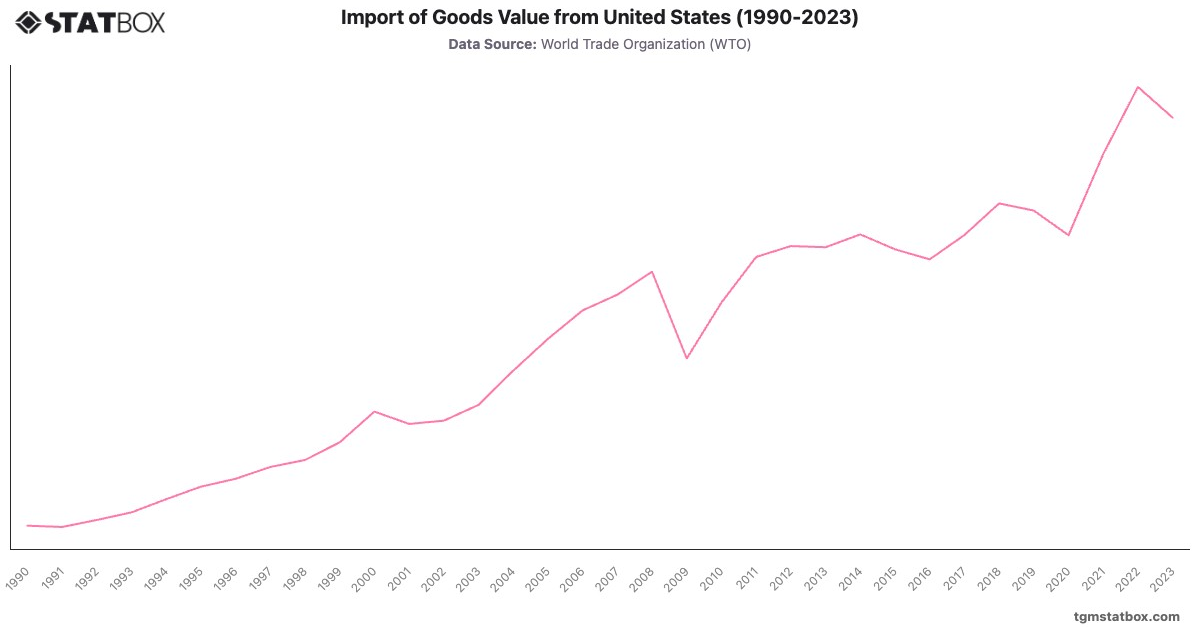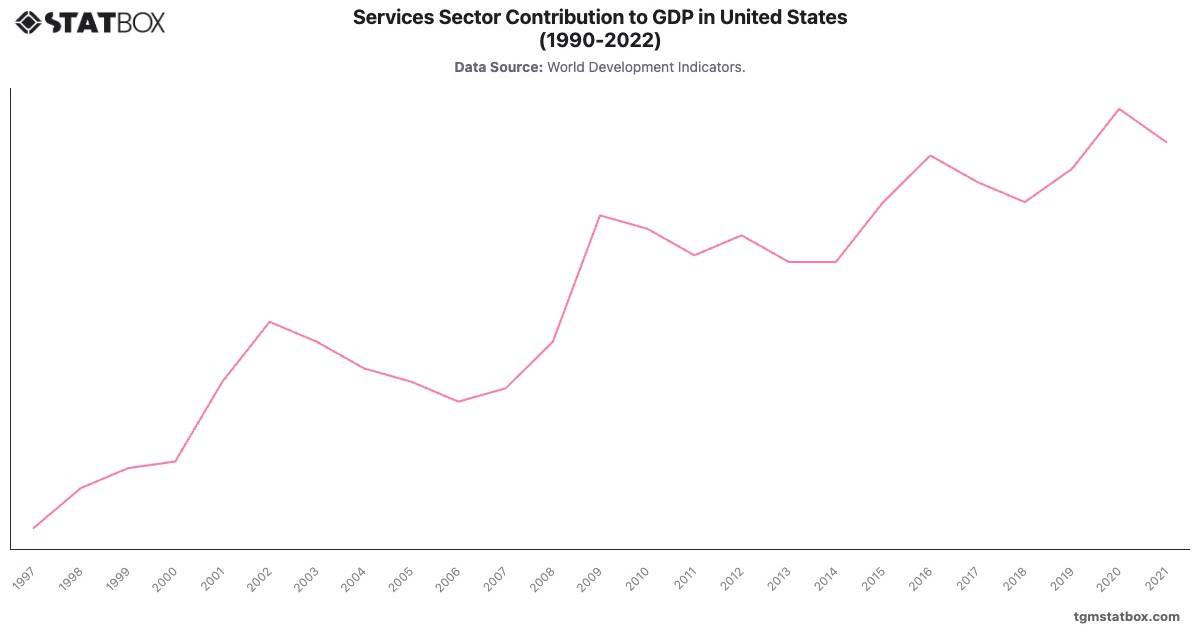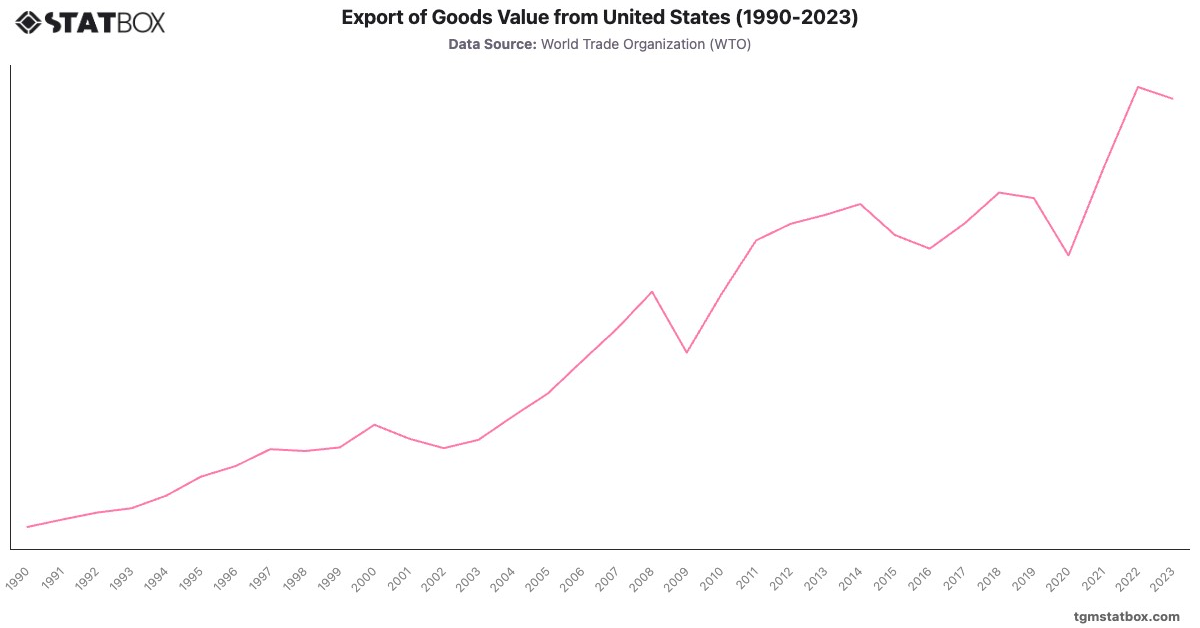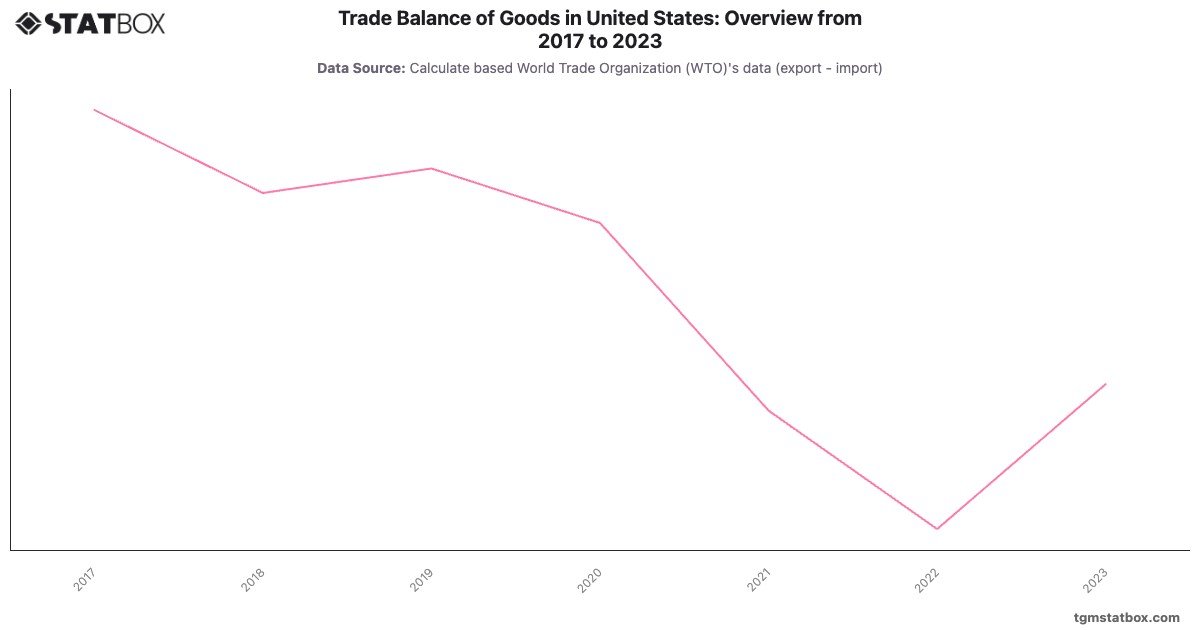
The United States recorded persistently high trade deficits, which expanded from -862,202.7 million USD in 2017 to a record -1,306,594.5 million USD in 2022, reflecting strong domestic demand for imported consumer goods, electronics, and energy. The deficit narrowed to -1,152,972.3 million USD in 2023, driven by reduced energy imports and increased exports of machinery and agricultural products.
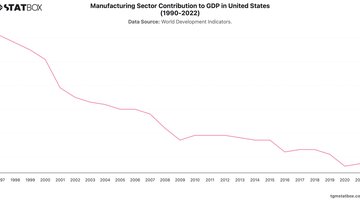
The U.S. trade balance underscores the challenges of a consumption-driven economy reliant on imports. Efforts to boost domestic manufacturing and energy production could help mitigate trade imbalances over the long term.
The U.S. trade balance underscores the challenges of a consumption-driven economy reliant on imports. Efforts to boost domestic manufacturing and energy production could help mitigate trade imbalances over the long term.
Discover additional trends and data on United States’ goods export value, US net financial position as a percentage of GDP, United States annual GDP growth rate.