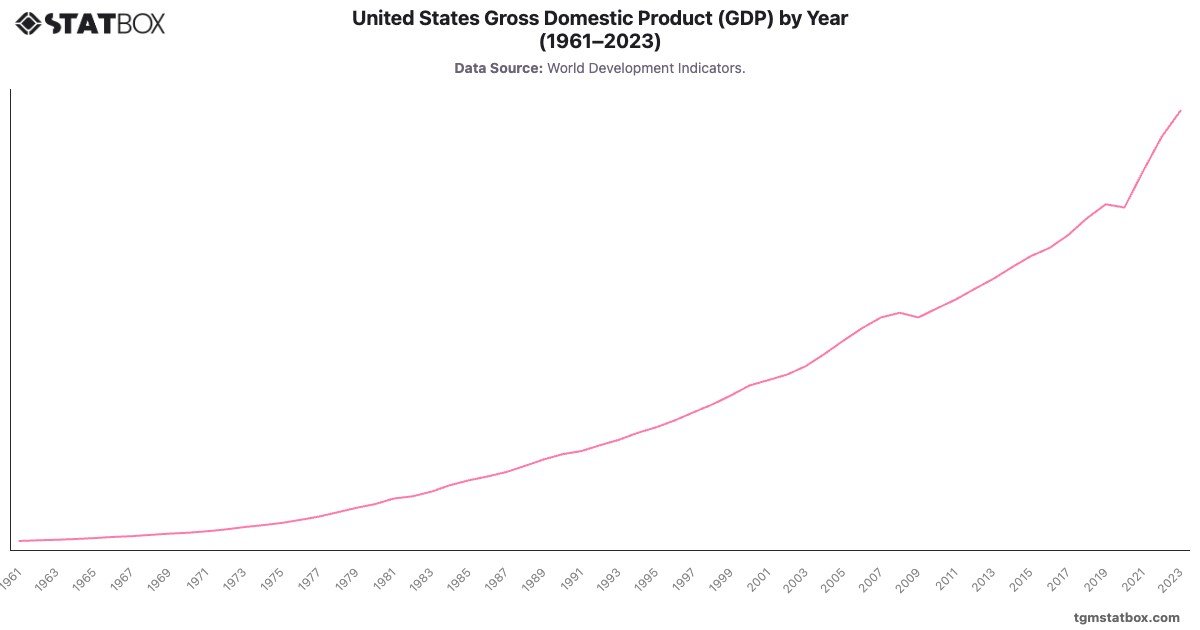
The United States GDP showcases steady growth, emphasizing its position as a global economic leader. Beginning at $562 billion in 1961, the economy expanded robustly through the 1960s, bolstered by industrial strength and government spending, reaching $813 billion in 1966. The 1970s energy crises and inflation slowed growth, but GDP still climbed to $1.68 trillion by 1975.
Significant milestones include surpassing $10 trillion in 2000, driven by technological innovation and globalization. Despite setbacks during the 2008 financial crisis, where GDP dipped to $14.47 trillion in 2009, the U.S. rebounded strongly, reaching $27.36 trillion in 2023. This growth was supported by tech advancements, diverse industries, and fiscal stimulus during COVID-19.
Significant milestones include surpassing $10 trillion in 2000, driven by technological innovation and globalization. Despite setbacks during the 2008 financial crisis, where GDP dipped to $14.47 trillion in 2009, the U.S. rebounded strongly, reaching $27.36 trillion in 2023. This growth was supported by tech advancements, diverse industries, and fiscal stimulus during COVID-19.
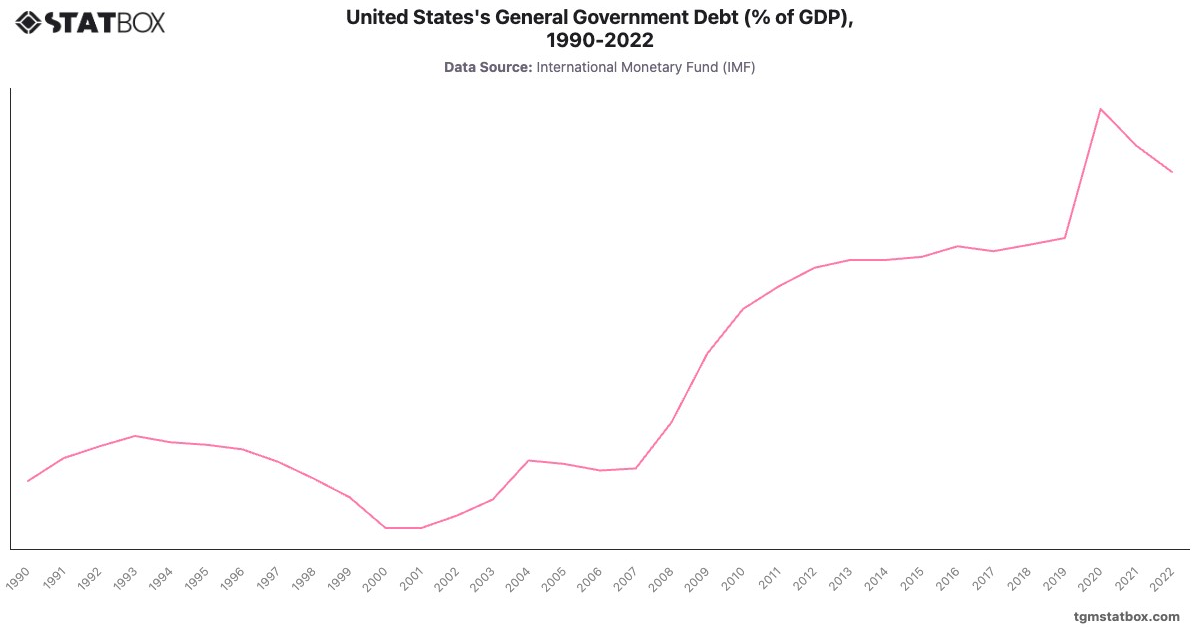
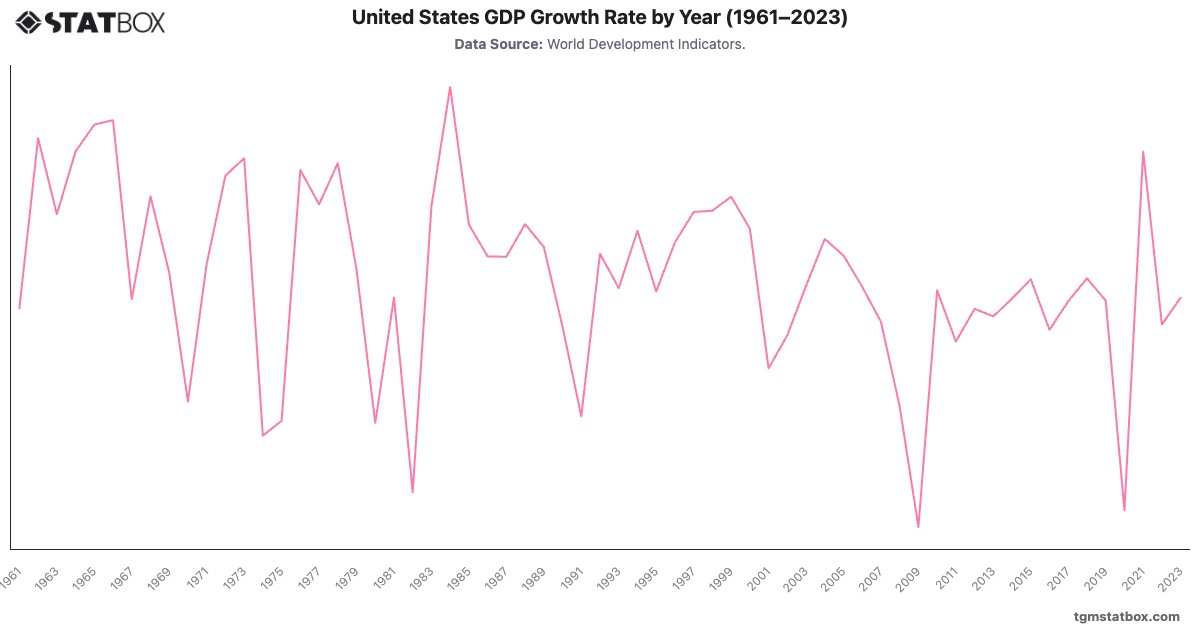
For a deeper dive into the topic, explore US central government debt as a percentage of GDP, United States annual GDP growth rate, US agriculture sector’s GDP share.