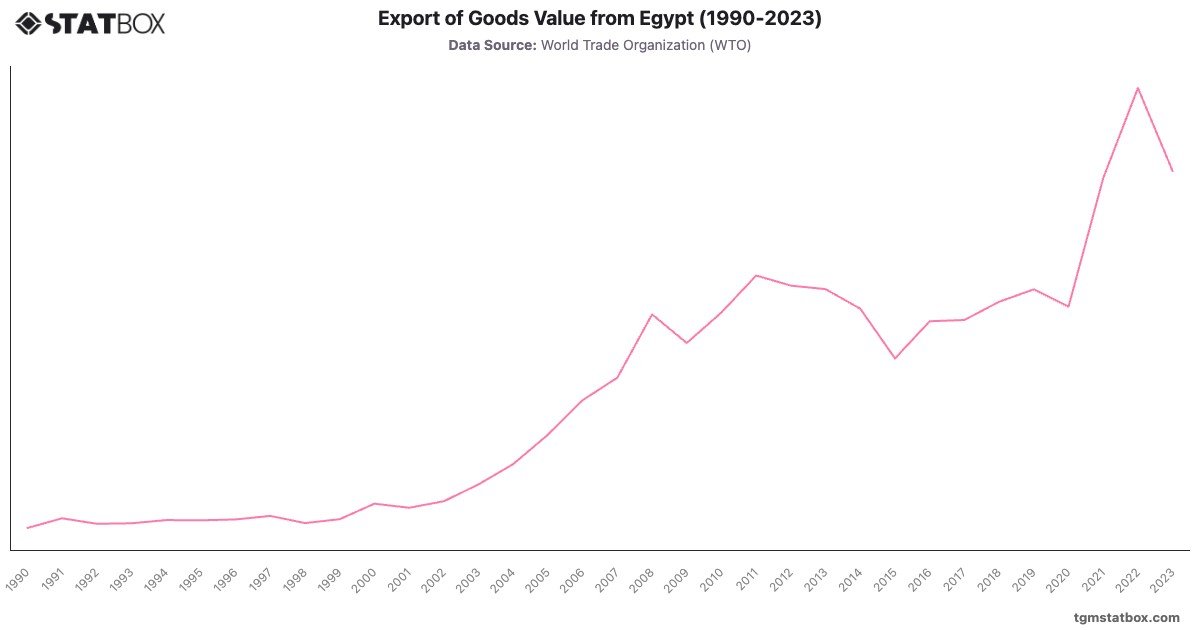
Egypt's export value showcased a steady upward trend over the decades, reflecting significant economic shifts and global market dynamics. Between 1990 and 2000, exports rose moderately from $2.6 billion to $5.3 billion, driven by the liberalization of the Egyptian economy and growing demand for petroleum and agricultural products. The early 2000s marked a rapid escalation, peaking at $26.4 billion in 2010. This growth was fueled by expanding industrial production and increased oil and gas exports, supported by global demand and rising energy prices.
Post-2011, the trajectory was less stable, affected by political upheavals and economic restructuring. Exports fluctuated but recovered significantly after 2020, reaching a record $51.3 billion in 2022 due to rising global commodity prices and diversification efforts. However, in 2023, exports dipped slightly to $42 billion, reflecting external market pressures. Overall, the data highlights Egypt's evolving role in the global trade landscape.
Post-2011, the trajectory was less stable, affected by political upheavals and economic restructuring. Exports fluctuated but recovered significantly after 2020, reaching a record $51.3 billion in 2022 due to rising global commodity prices and diversification efforts. However, in 2023, exports dipped slightly to $42 billion, reflecting external market pressures. Overall, the data highlights Egypt's evolving role in the global trade landscape.
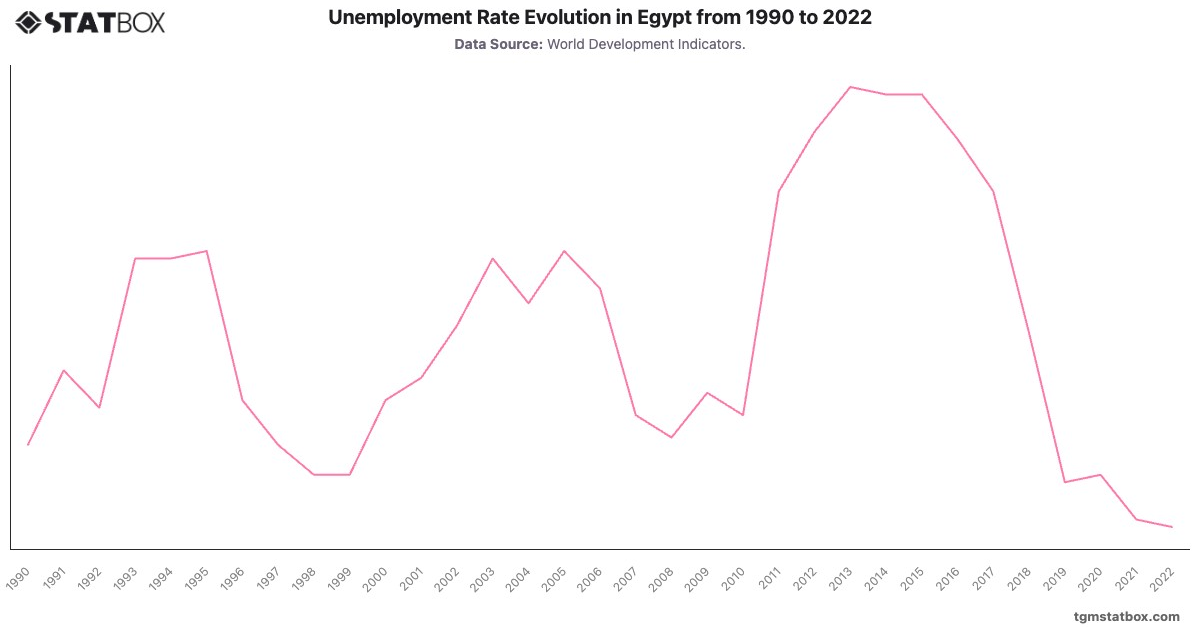
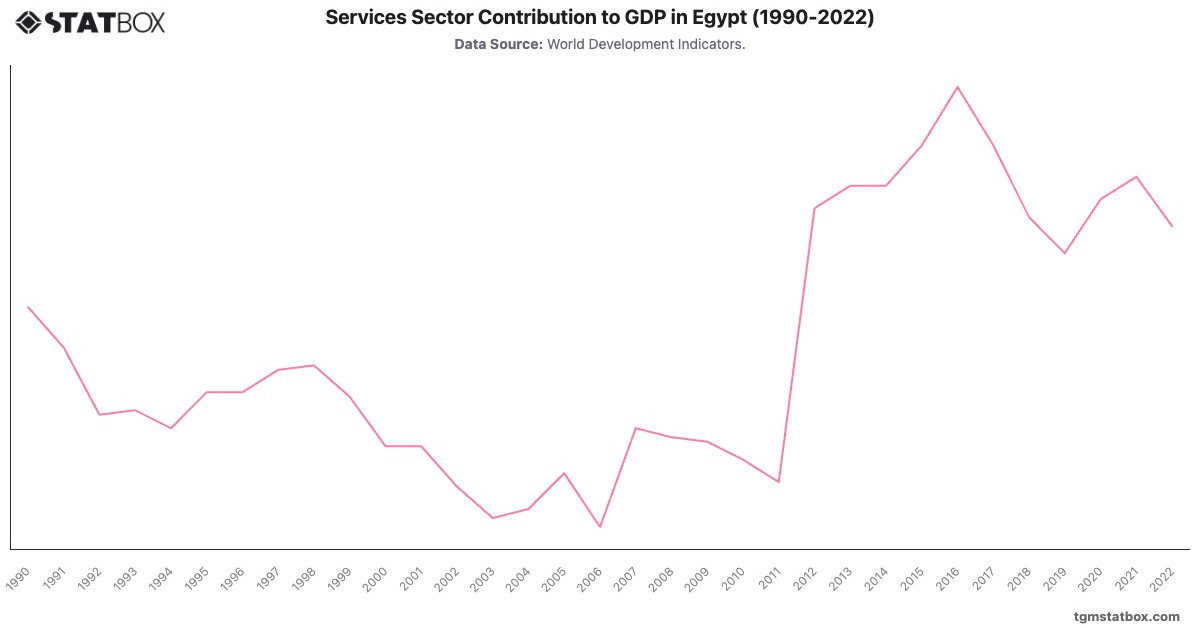
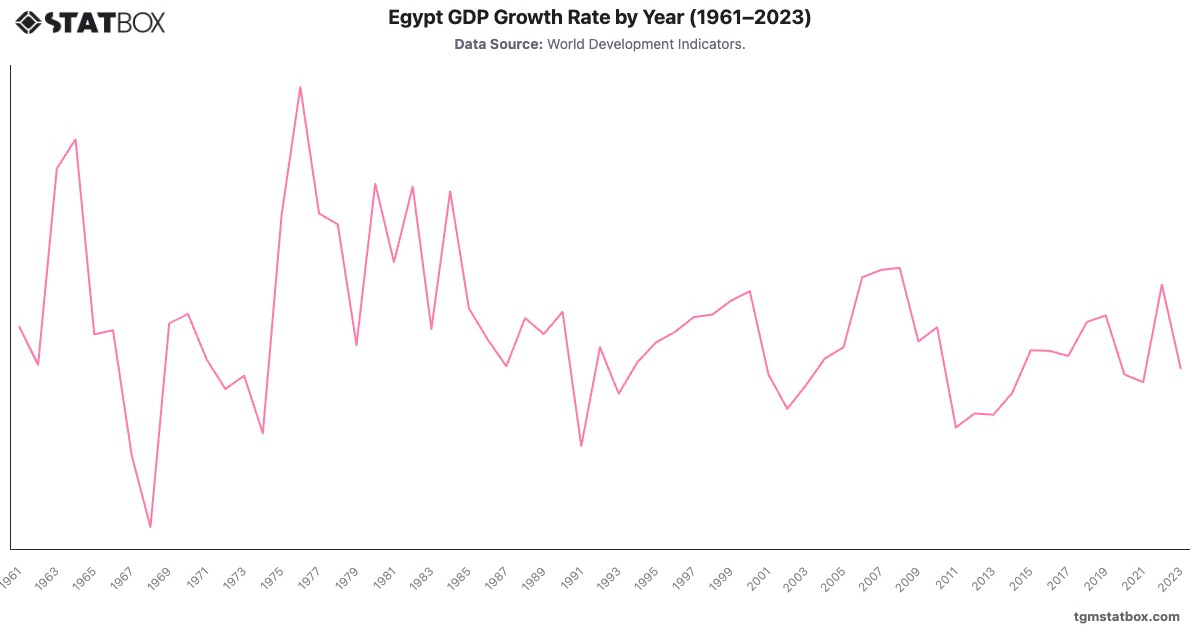
Gain a broader perspective by reviewing Egypt’s annual GDP, Egypt’s unemployment rate, Egypt’s services sector share in GDP.