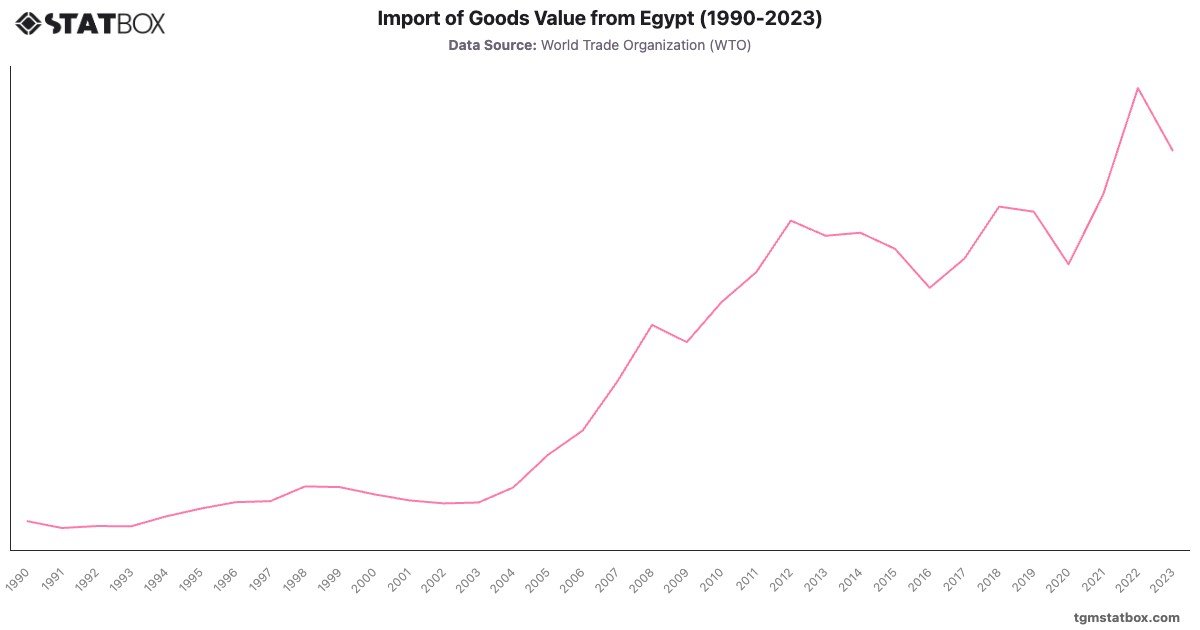
Egypt’s imports grew from $9.2B in 1990 to a peak of $95.6B in 2022, driven by population growth, industrial expansion, and infrastructure development. Key growth periods include the 2000s, with imports rising from $14.5B in 2000 to $48.3B in 2008 due to increased consumer spending and energy projects.
The post-2011 period saw fluctuating imports amid political instability, but imports stabilized and peaked at $95.6B in 2022 due to rising energy and food needs. A dip to $83.1B in 2023 reflects global and domestic economic pressures. Egypt’s import trends emphasize its growing economy and reliance on imports for critical sectors like energy and agriculture.
The post-2011 period saw fluctuating imports amid political instability, but imports stabilized and peaked at $95.6B in 2022 due to rising energy and food needs. A dip to $83.1B in 2023 reflects global and domestic economic pressures. Egypt’s import trends emphasize its growing economy and reliance on imports for critical sectors like energy and agriculture.
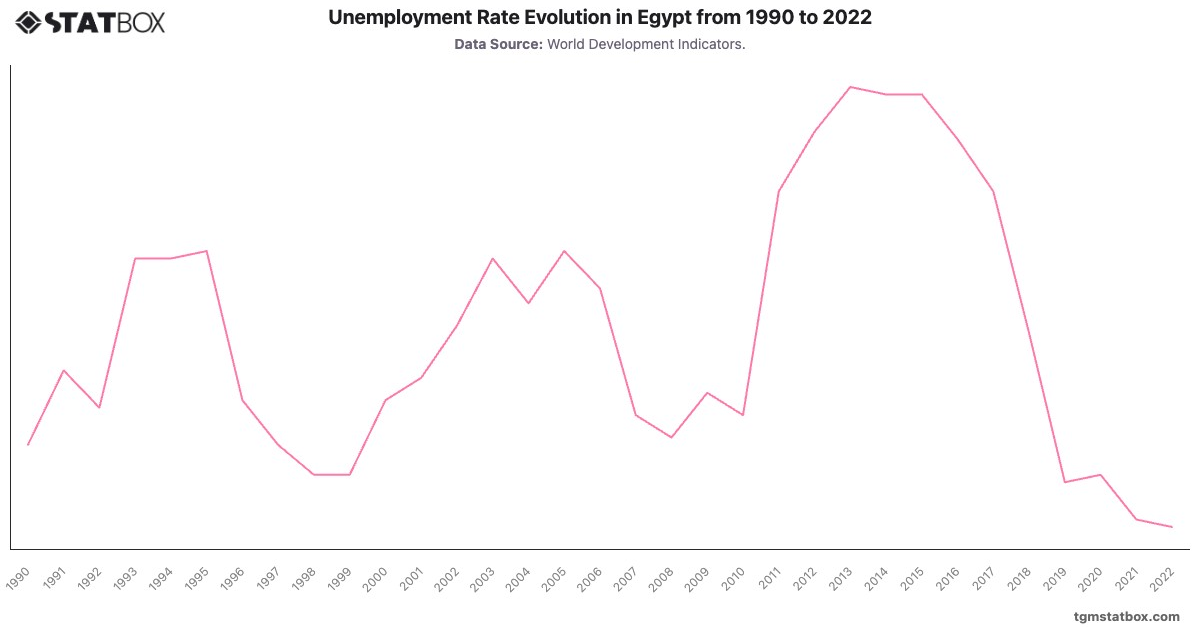
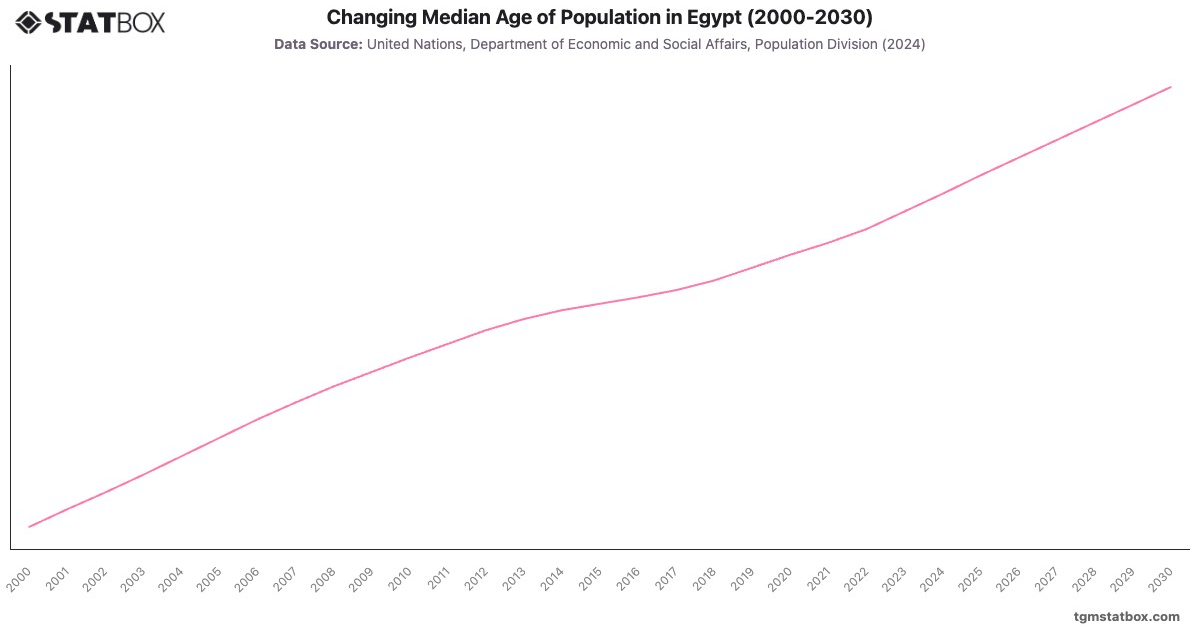
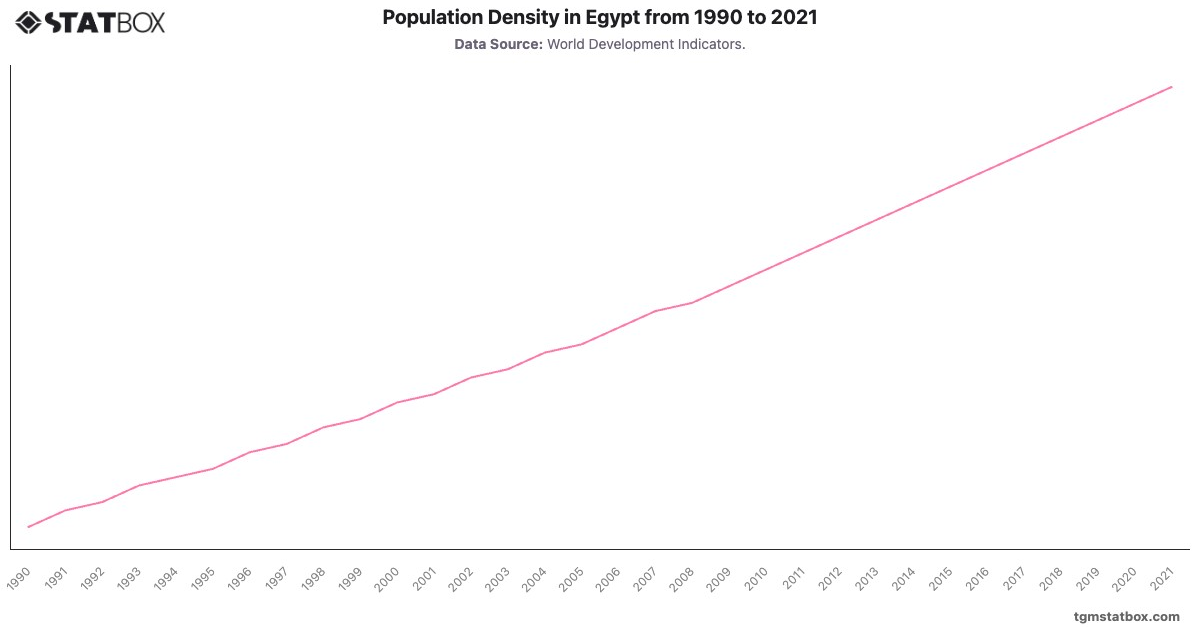
Explore related charts to gain a better understanding of Egypt’s unemployment rate, Egypt’s population growth rate, Egypt’s population density metric.