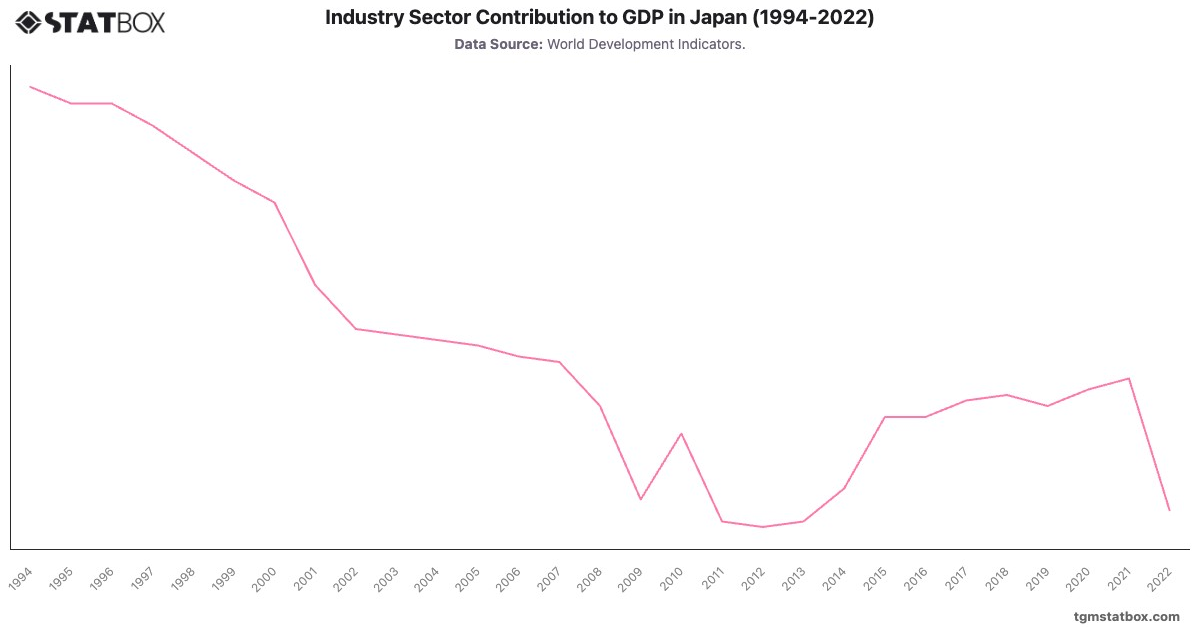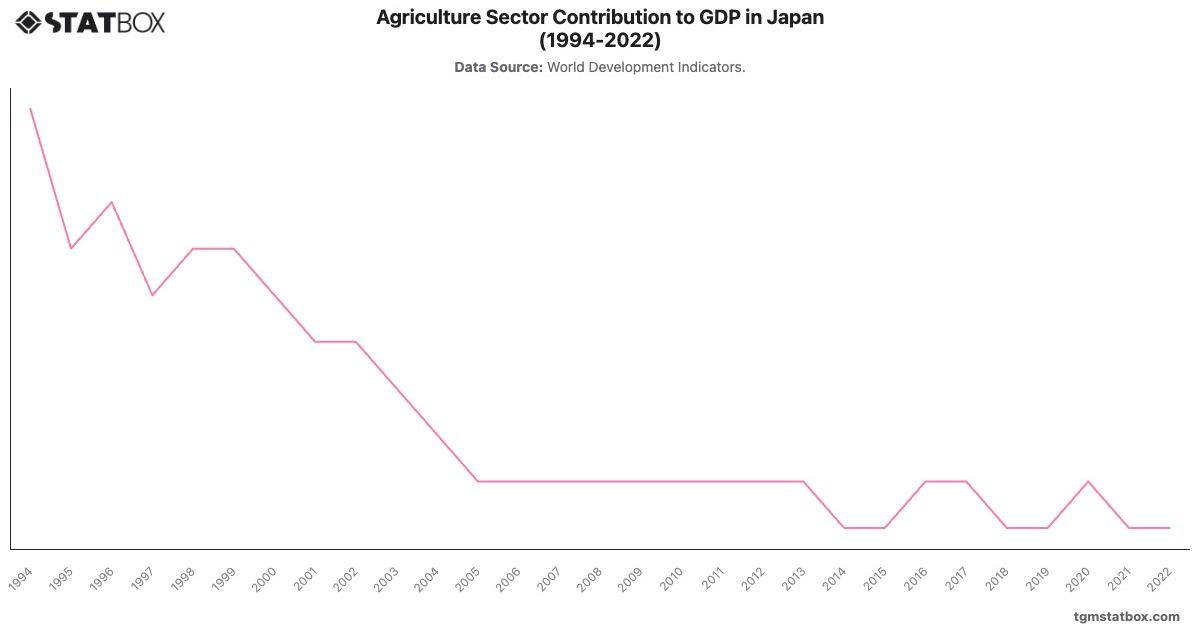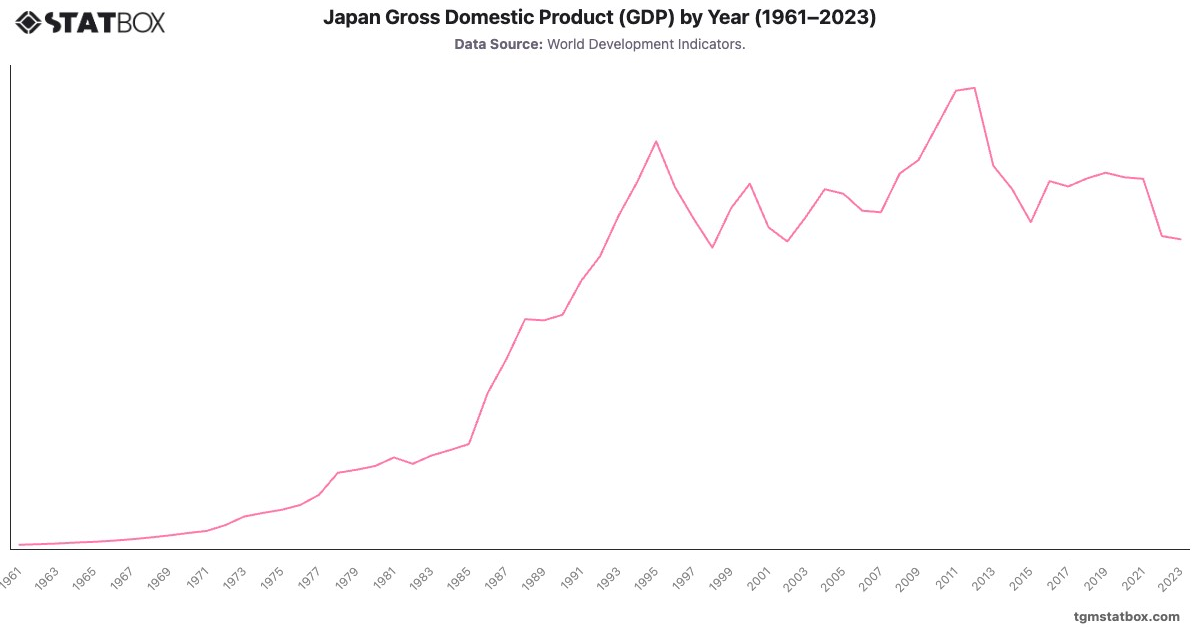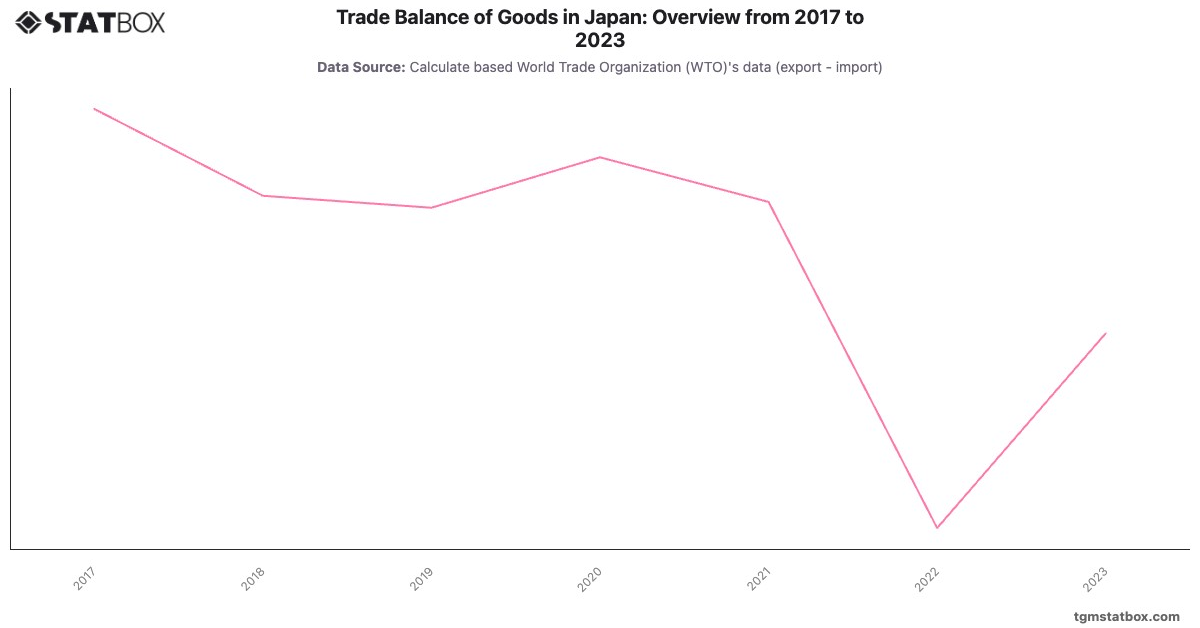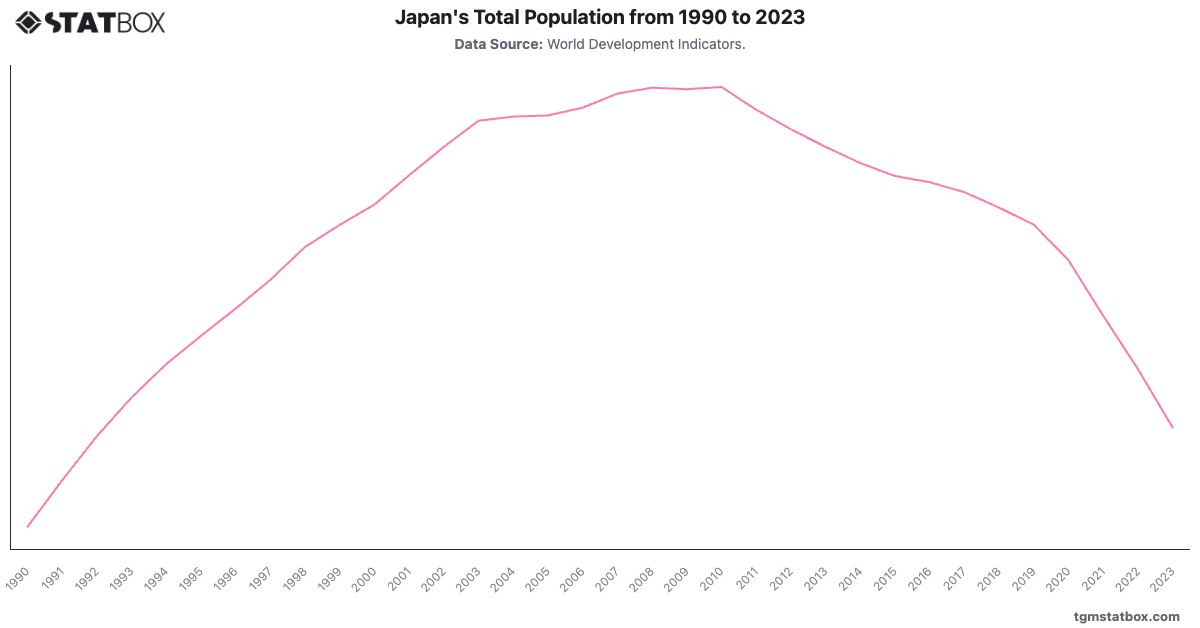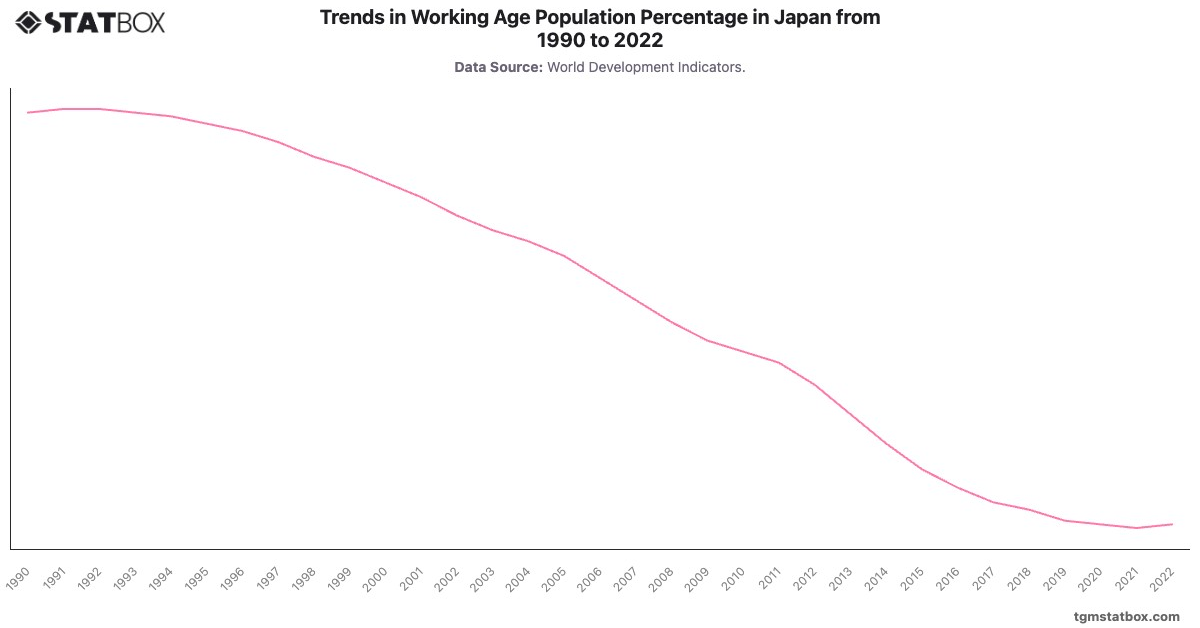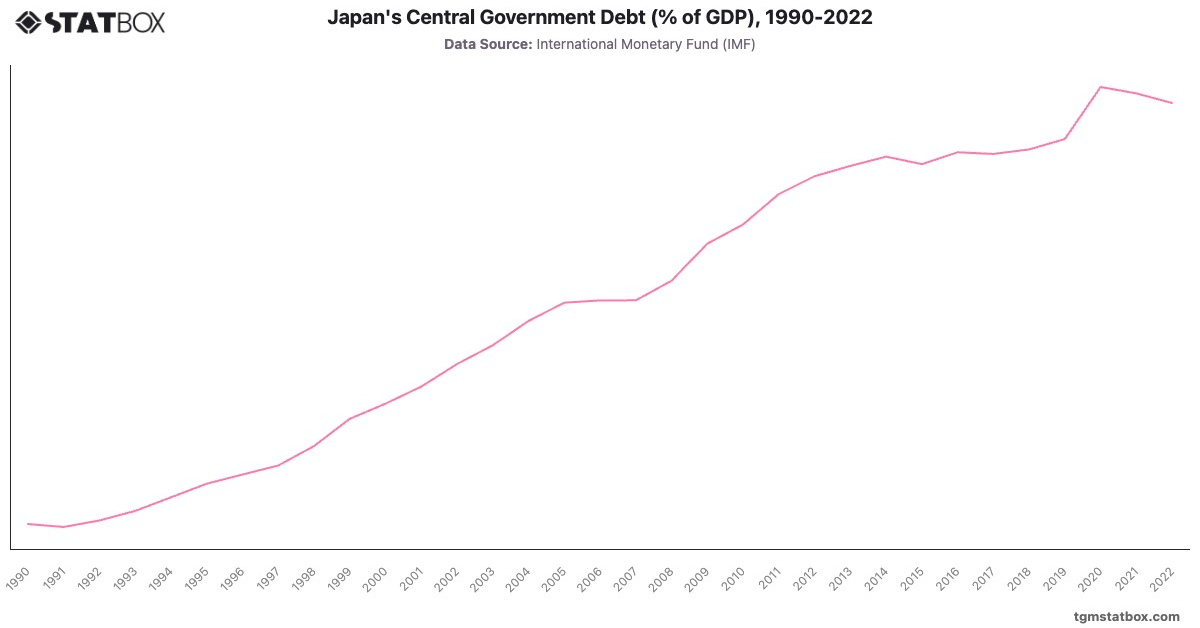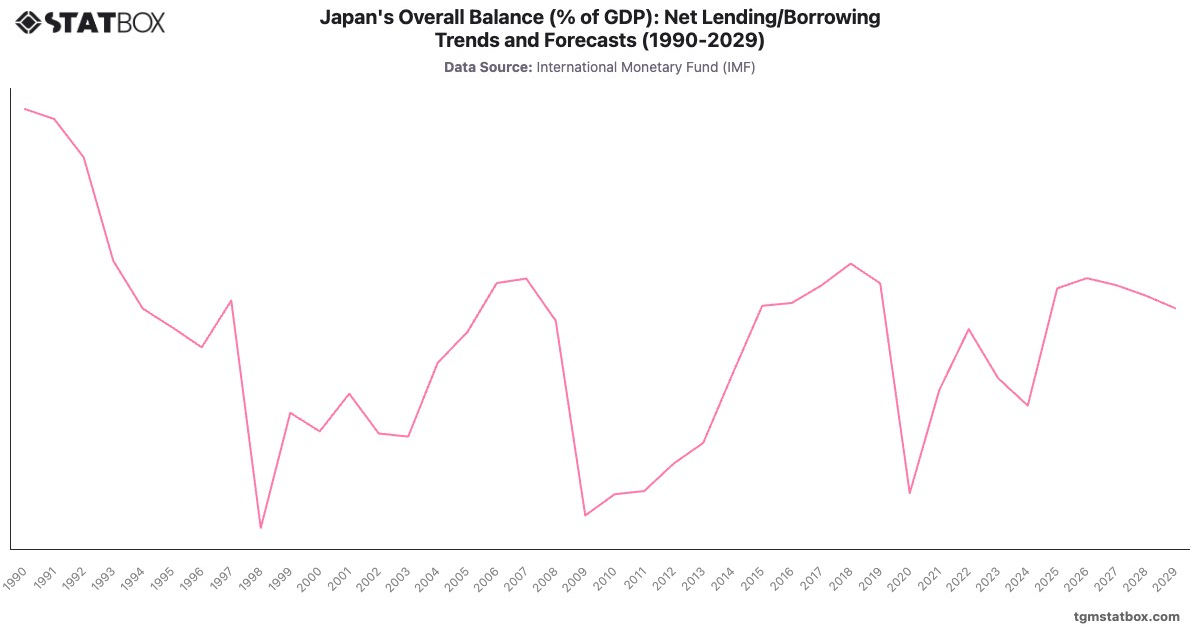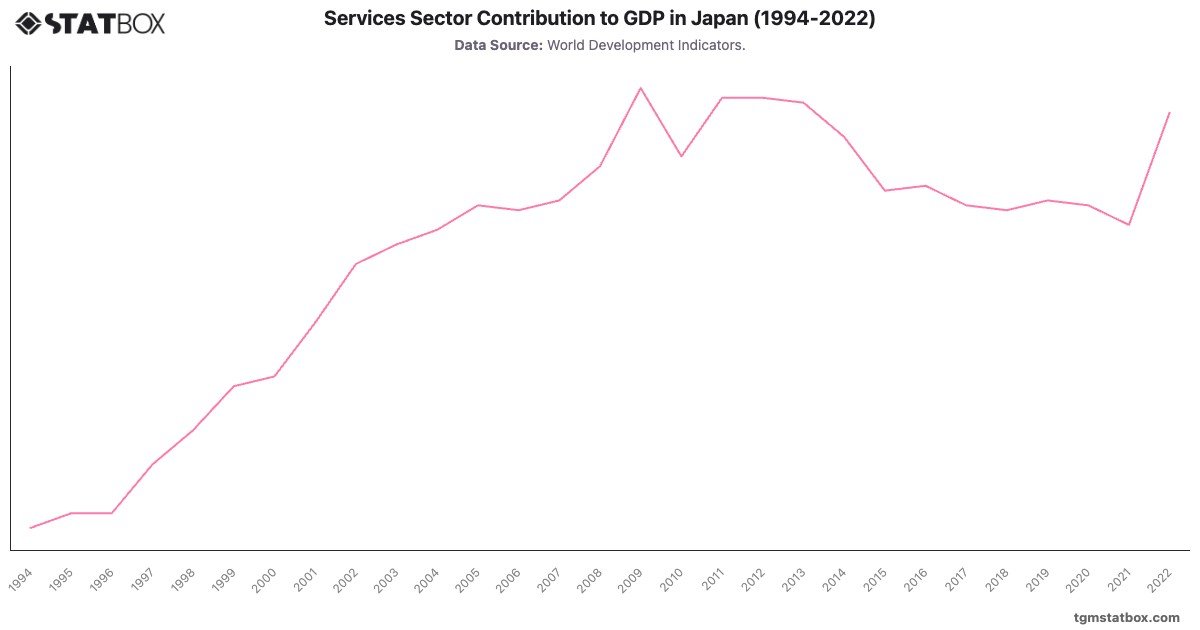
Japan’s services sector has shown consistent expansion, reflecting the country’s mature economy and shift towards high-value services. Beginning at in 1994, the sector grew steadily, reaching by 2003, driven by technological advancements and consumer services. The Global Financial Crisis and subsequent recovery initiatives saw an increase to in 2009. Despite challenges, the sector maintained stability, fluctuating near from 2014 to 2020. By 2022, services contributed to GDP, aided by Japan’s aging population and increased demand for healthcare and social services. This trend highlights Japan’s shift from manufacturing to a service-oriented economy, focusing on healthcare, education, and financial services, essential for sustaining growth amidst demographic pressures.
Gain a broader perspective by reviewing Japan’s population density estimate, Japan’s manufacturing sector share in GDP, Japan’s urbanization trend.