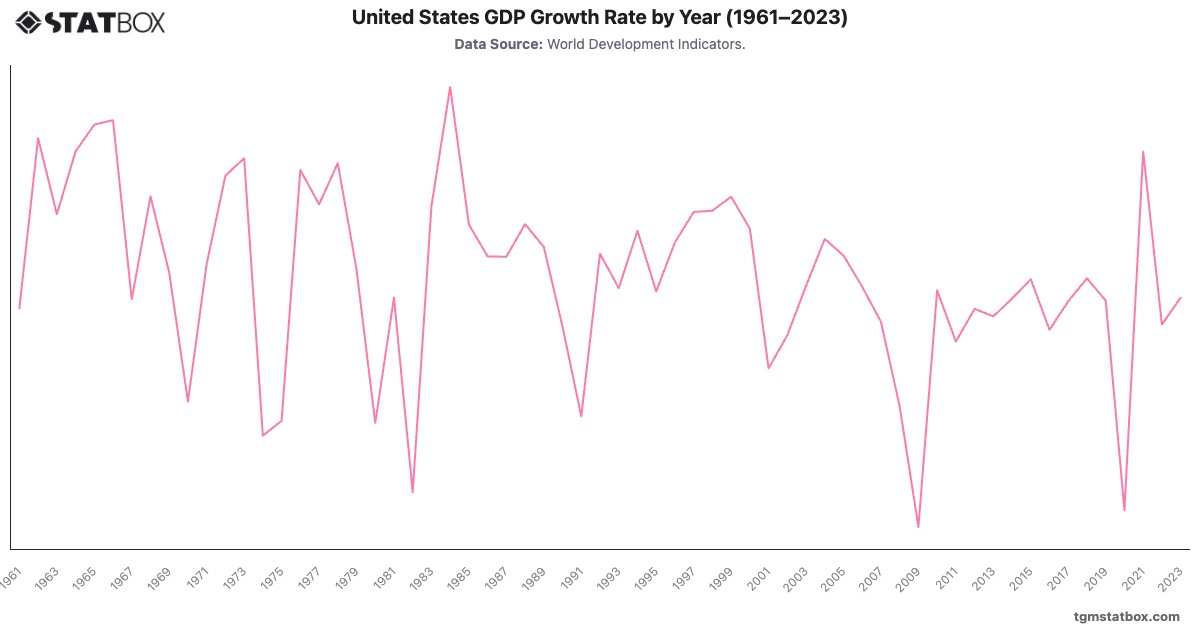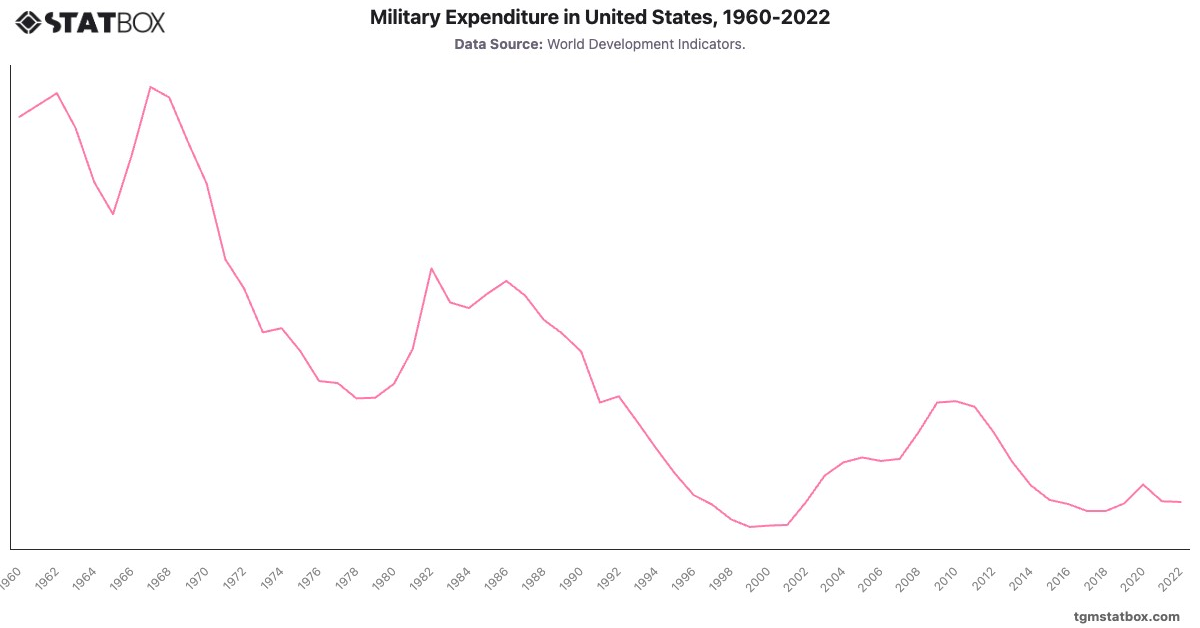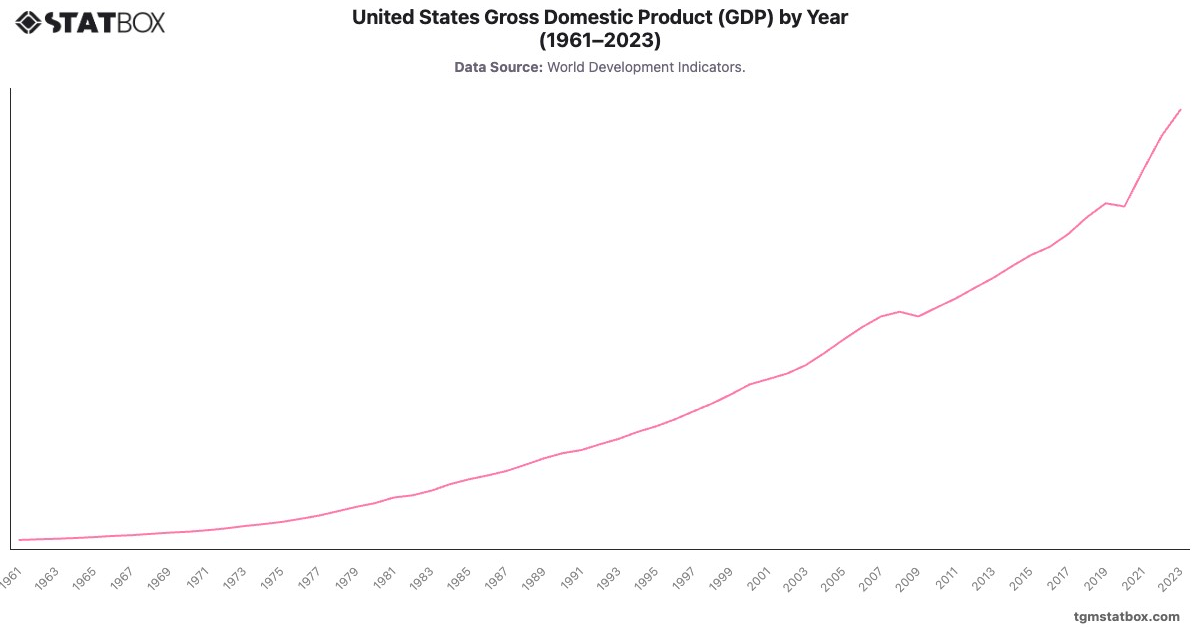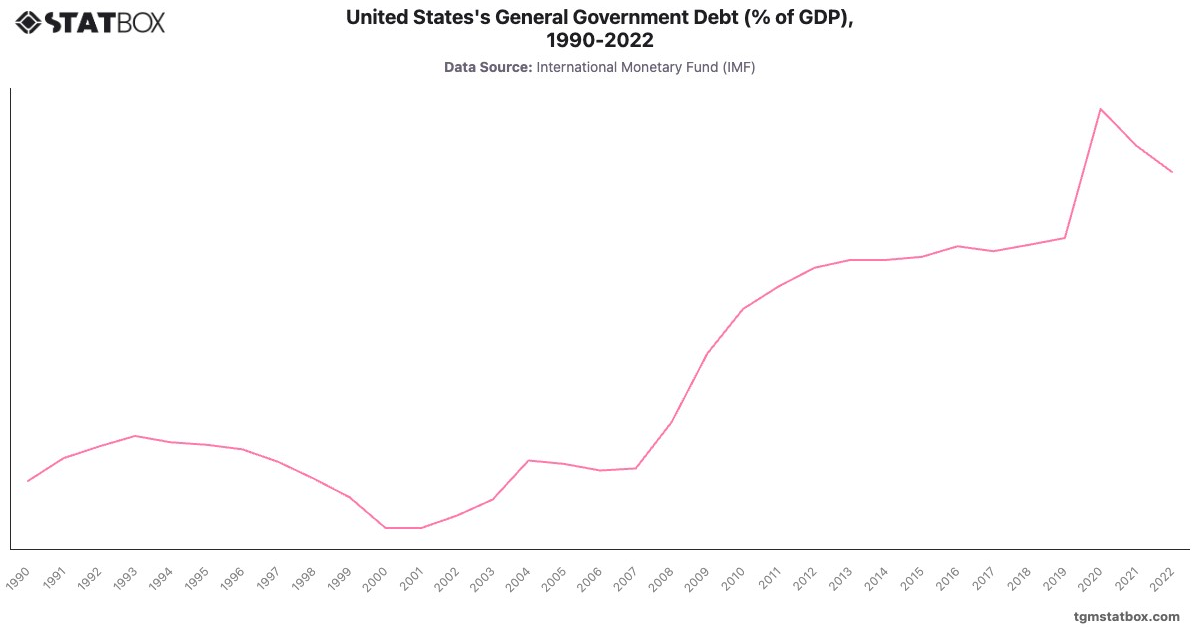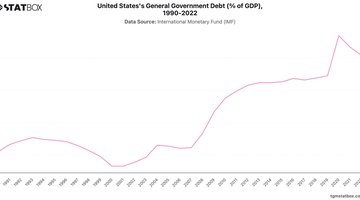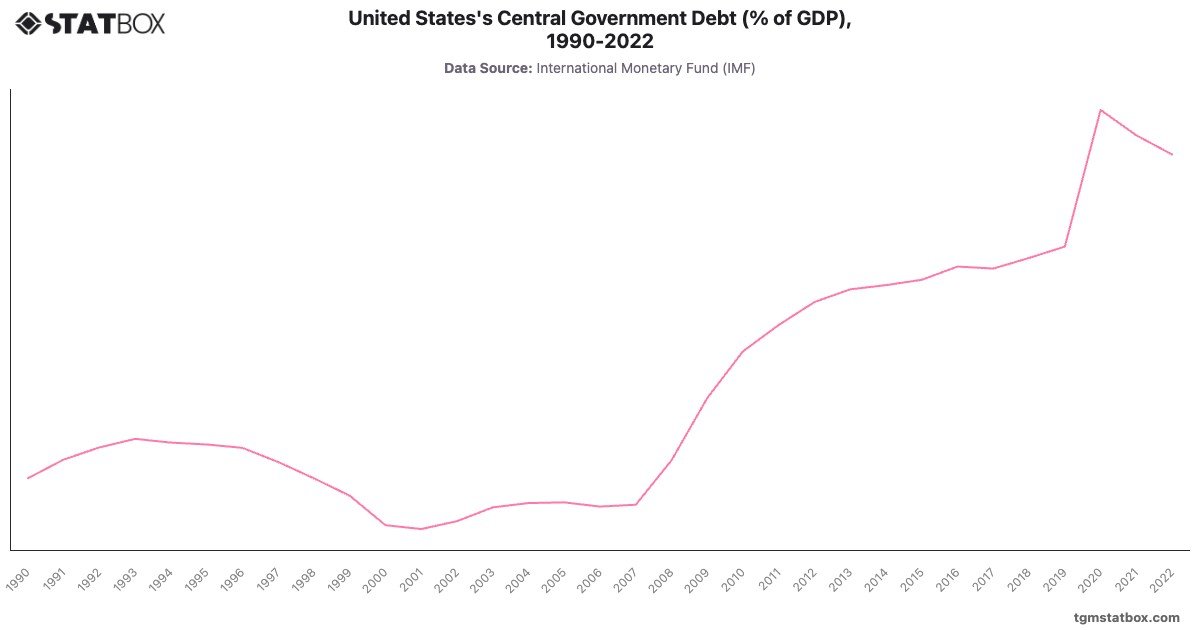
The United States' central government debt as a percentage of GDP exhibited notable fluctuations over the analyzed period. Between 1990 and 2000, the debt-to-GDP ratio decreased significantly, from in 1990 to a low of in 2001. This decline was driven by robust economic growth during the 1990s, coupled with fiscal policies aimed at deficit reduction, particularly during the Clinton administration.
However, from 2001 onward, debt levels began to rise again, peaking at in 2020. This growth was initially influenced by increased government spending following the 9/11 attacks and subsequent wars in Afghanistan and Iraq. The financial crisis of 2008 further escalated debt levels, reaching in 2009, as the government implemented large-scale stimulus measures. The COVID-19 pandemic led to an unprecedented surge in government borrowing, with emergency relief measures pushing debt levels to their 2020 peak. By 2022, the ratio slightly declined to , reflecting economic recovery and easing fiscal deficits.
However, from 2001 onward, debt levels began to rise again, peaking at in 2020. This growth was initially influenced by increased government spending following the 9/11 attacks and subsequent wars in Afghanistan and Iraq. The financial crisis of 2008 further escalated debt levels, reaching in 2009, as the government implemented large-scale stimulus measures. The COVID-19 pandemic led to an unprecedented surge in government borrowing, with emergency relief measures pushing debt levels to their 2020 peak. By 2022, the ratio slightly declined to , reflecting economic recovery and easing fiscal deficits.
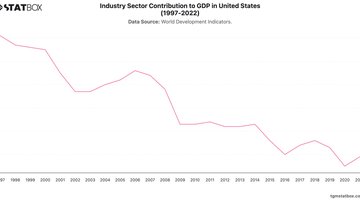
Discover additional trends and data on United States’ general government debt-to-GDP ratio, US working-age population share, Industry sector’s share in US GDP.