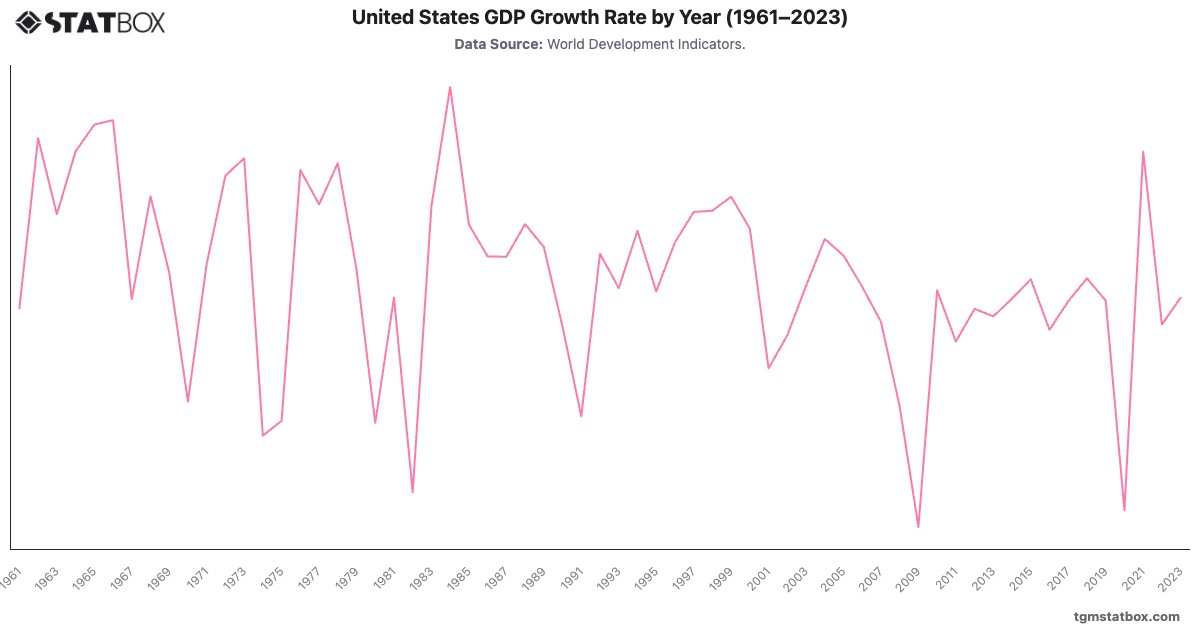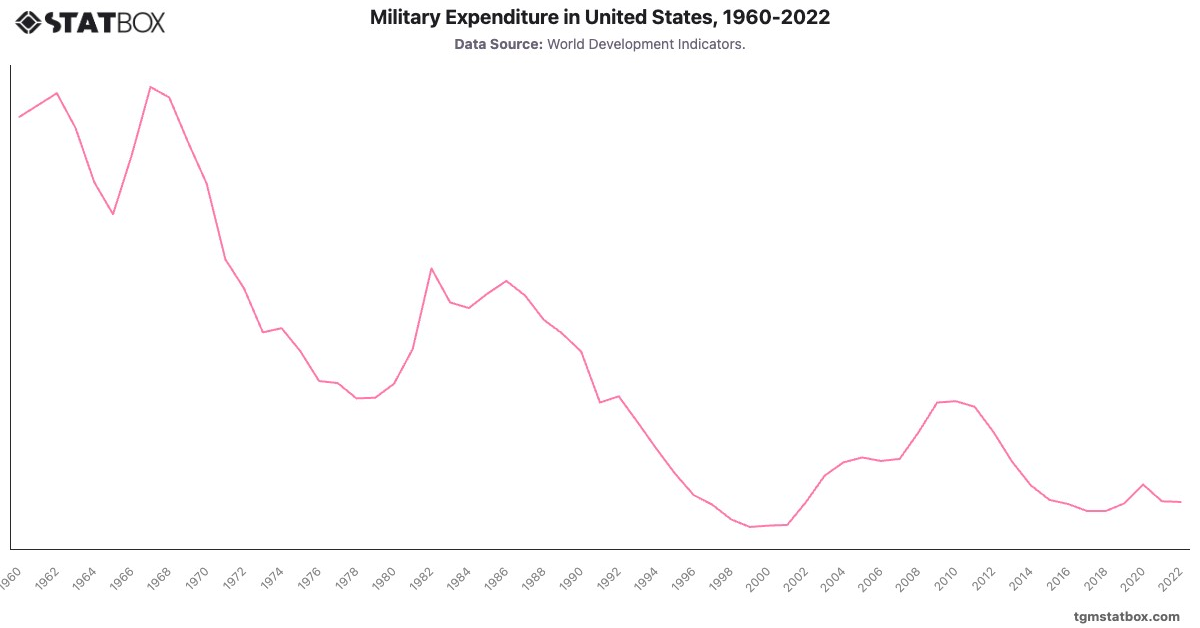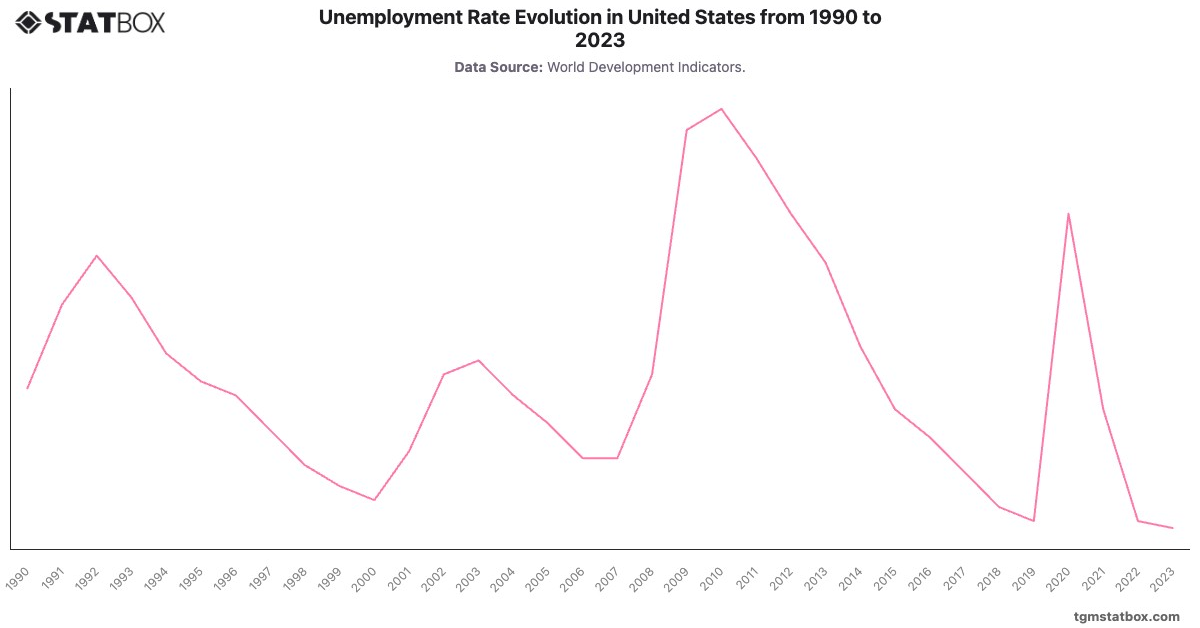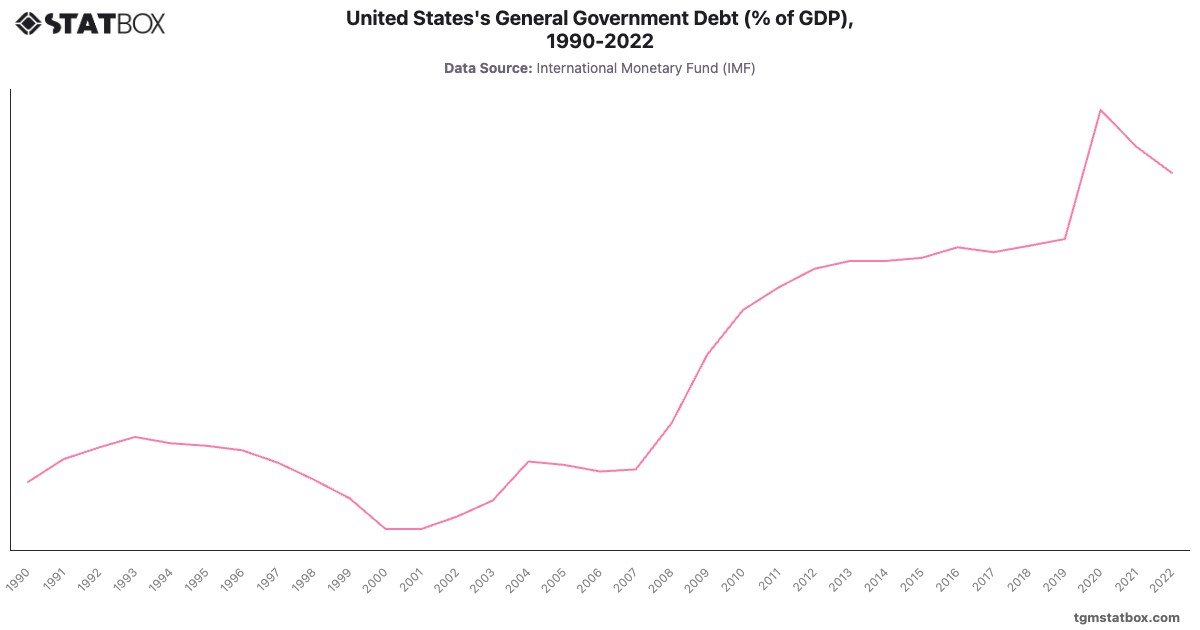
The United States maintained relatively stable debt levels throughout the 1990s, with debt-to-GDP ratios ranging from in 1990 to by 2000. However, increased defense and security spending post-9/11, combined with tax cuts, led to rising debt in the early 2000s. The 2008 financial crisis accelerated this increase, with debt climbing from in 2007 to in 2009 as the U.S. implemented stimulus measures.
Debt surpassed of GDP in 2012 and remained high through the following decade, reflecting continuous government borrowing. The COVID-19 pandemic exacerbated this trend, with debt peaking at in 2020 due to substantial stimulus packages. As economic recovery took hold, debt decreased slightly to by 2022, though fiscal challenges persist due to high expenditure levels.
Debt surpassed of GDP in 2012 and remained high through the following decade, reflecting continuous government borrowing. The COVID-19 pandemic exacerbated this trend, with debt peaking at in 2020 due to substantial stimulus packages. As economic recovery took hold, debt decreased slightly to by 2022, though fiscal challenges persist due to high expenditure levels.
Gain a broader perspective by reviewing United States annual GDP growth rate, US net financial position as a percentage of GDP, US annual GDP figures.