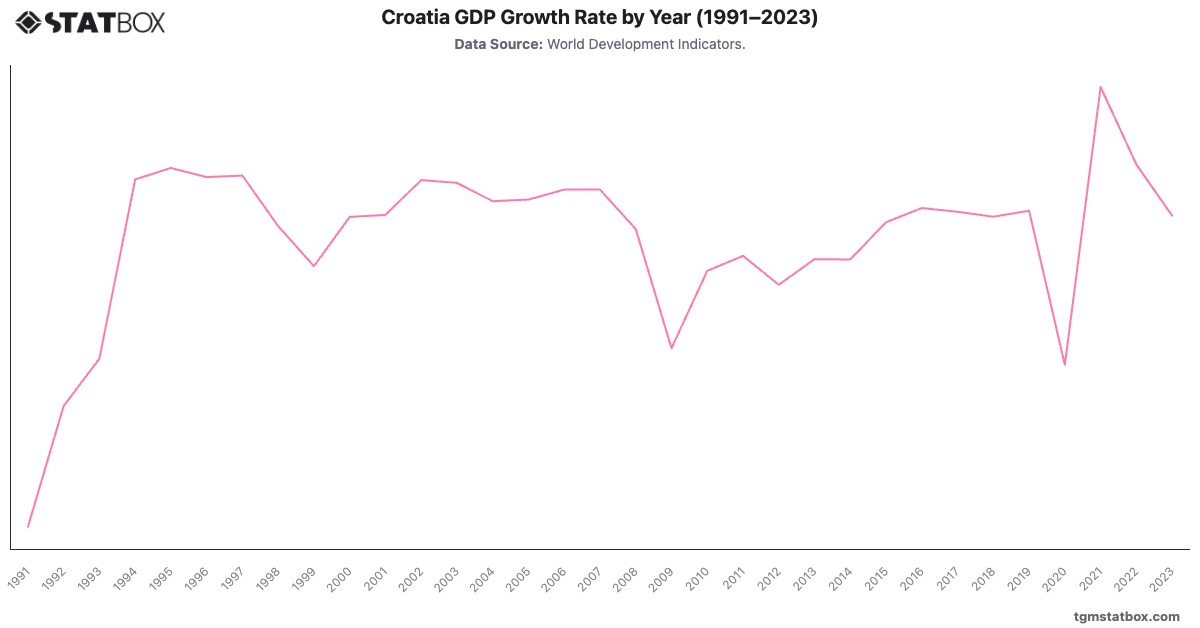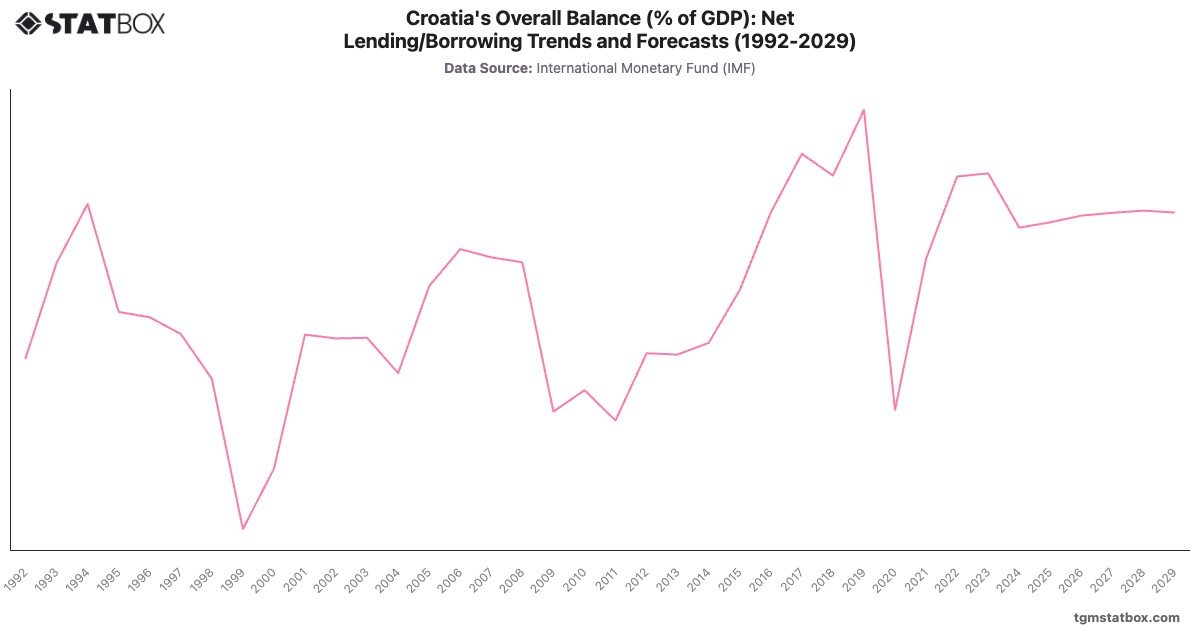
Croatia’s fiscal journey highlights recovery from economic shocks and successful integration into the EU. The late 1990s and early 2000s saw high deficits, peaking at - in 1999, reflecting post-war reconstruction and structural challenges. The 2010s brought improvements, with surpluses emerging by 2019 ().
The pandemic reversed gains, widening the deficit to - in 2020. Forecasts indicate stabilization around - by 2029, supported by fiscal discipline and EU-backed reforms. Croatia’s fiscal resilience underscores its ability to navigate economic transitions effectively.
The pandemic reversed gains, widening the deficit to - in 2020. Forecasts indicate stabilization around - by 2029, supported by fiscal discipline and EU-backed reforms. Croatia’s fiscal resilience underscores its ability to navigate economic transitions effectively.
For a deeper dive into the topic, explore Croatia’s unemployment rate, Croatia’s public debt ratio, Croatia’s working-age population percentage trend.