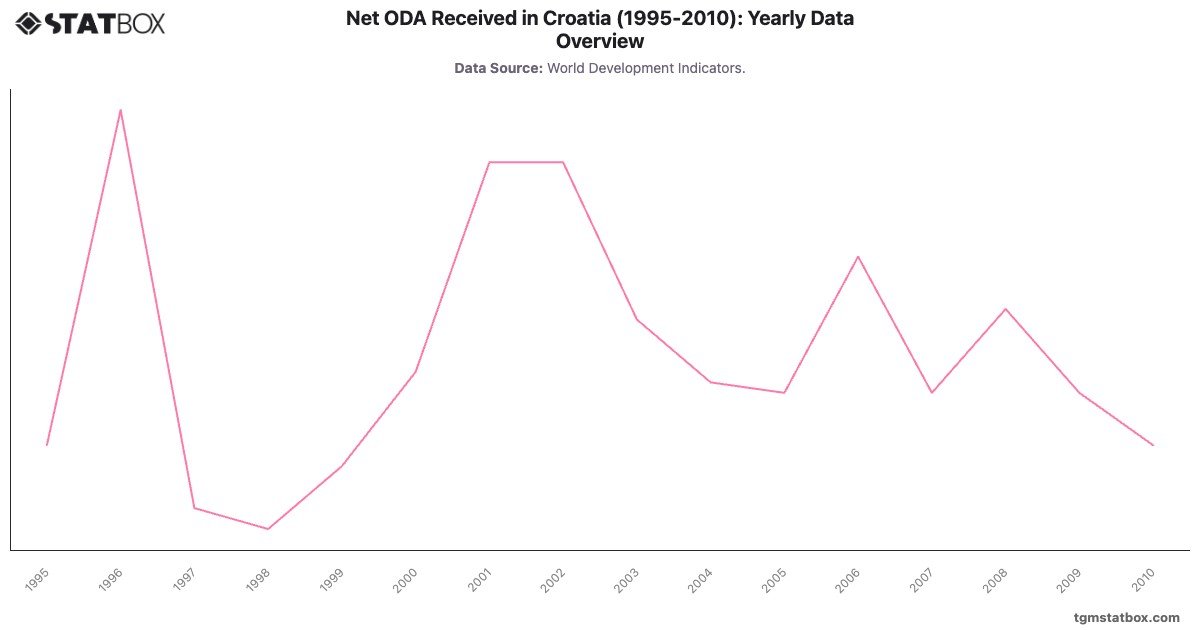
Croatia’s Net ODA (% of GNI) remained low, with modest increases during its transition period following the Yugoslav Wars in the mid-1990s. Levels peaked at in 1996, reflecting donor assistance for post-war reconstruction and economic stabilization.
By the 2010s, Croatia’s ODA levels had dropped to , indicating its successful integration into the European Union and a reduced need for external aid as it transitioned to a high-income status.
By the 2010s, Croatia’s ODA levels had dropped to , indicating its successful integration into the European Union and a reduced need for external aid as it transitioned to a high-income status.
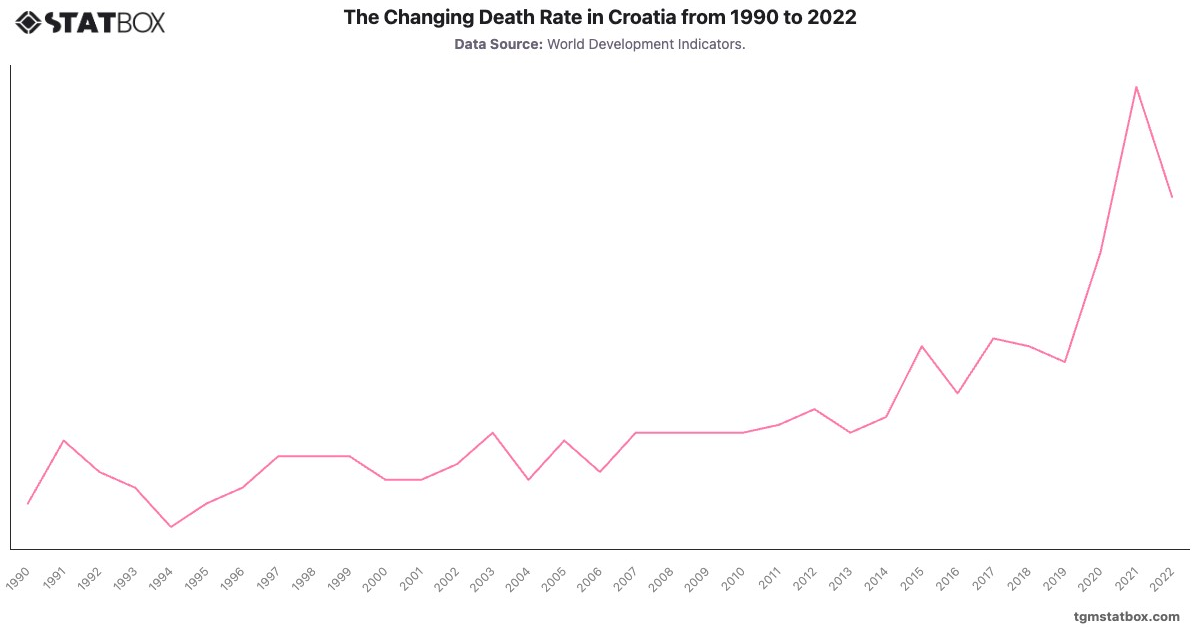
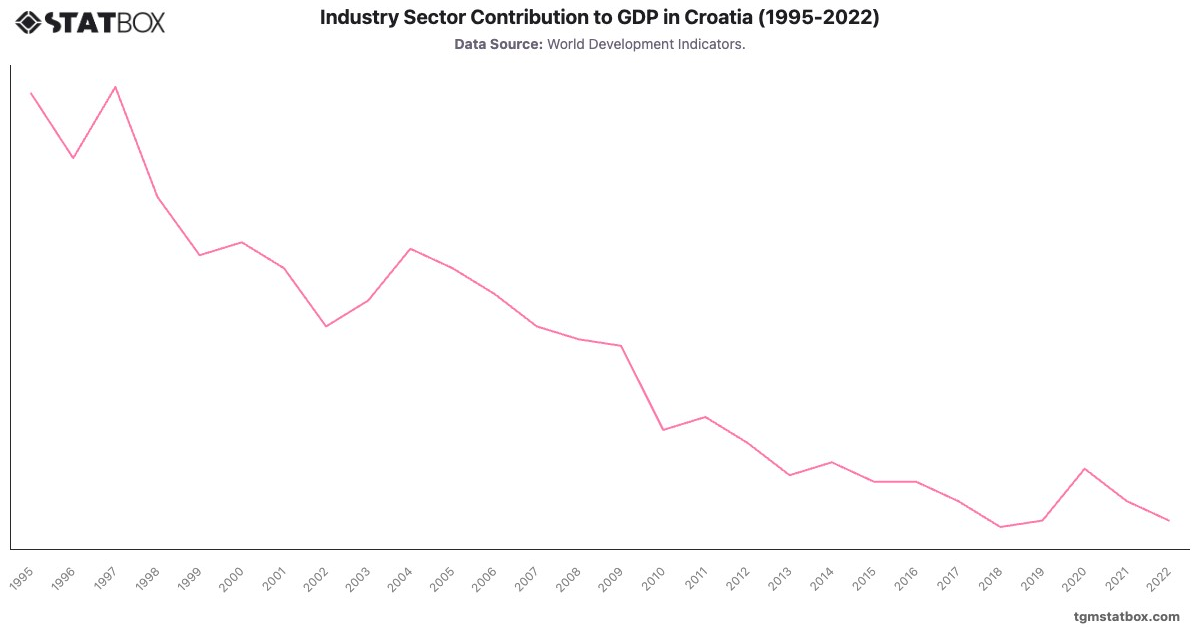
Find out more through related statistics on Croatia’s mortality rate changes, Croatia’s manufacturing sector share in GDP, Croatia’s industry sector share in GDP.