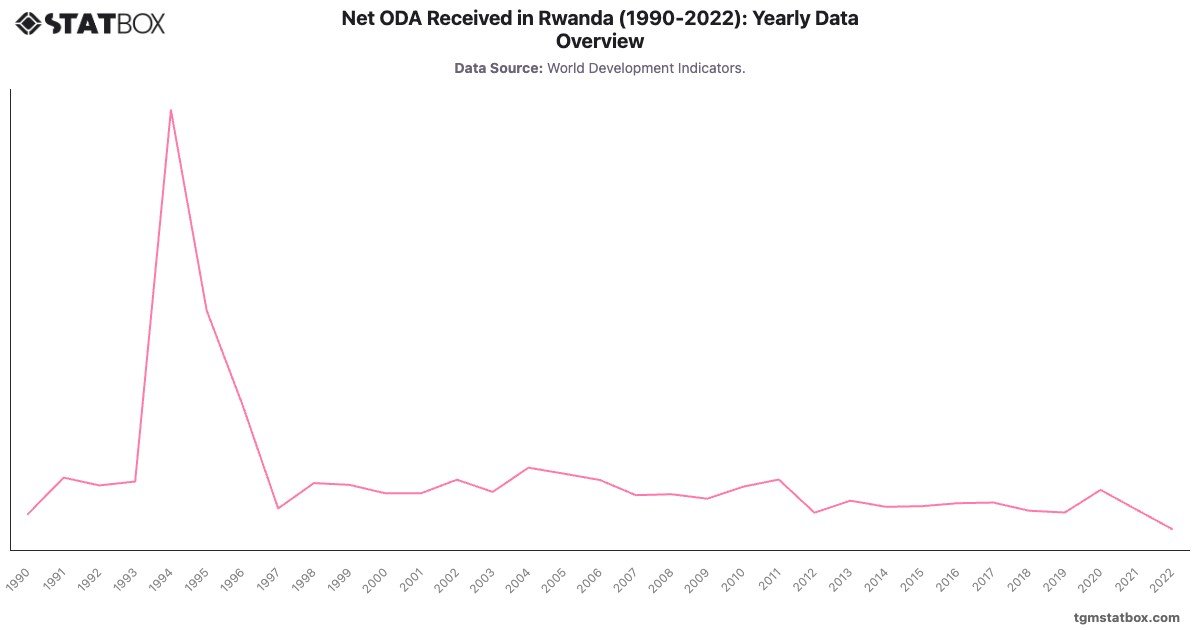
Rwanda’s Net ODA (% of GNI) surged to an extraordinary in 1994, driven by emergency aid during the genocide crisis. Post-conflict reconstruction kept aid levels high throughout the late 1990s, peaking at in 1995. Subsequent declines reflected Rwanda’s economic stabilization and governance improvements.
Recent increases, such as in 2020, correspond to global health and recovery efforts during the COVID-19 pandemic. By 2022, ODA decreased to , indicating Rwanda’s gradual reduction in donor reliance as domestic capacity improves.
Recent increases, such as in 2020, correspond to global health and recovery efforts during the COVID-19 pandemic. By 2022, ODA decreased to , indicating Rwanda’s gradual reduction in donor reliance as domestic capacity improves.
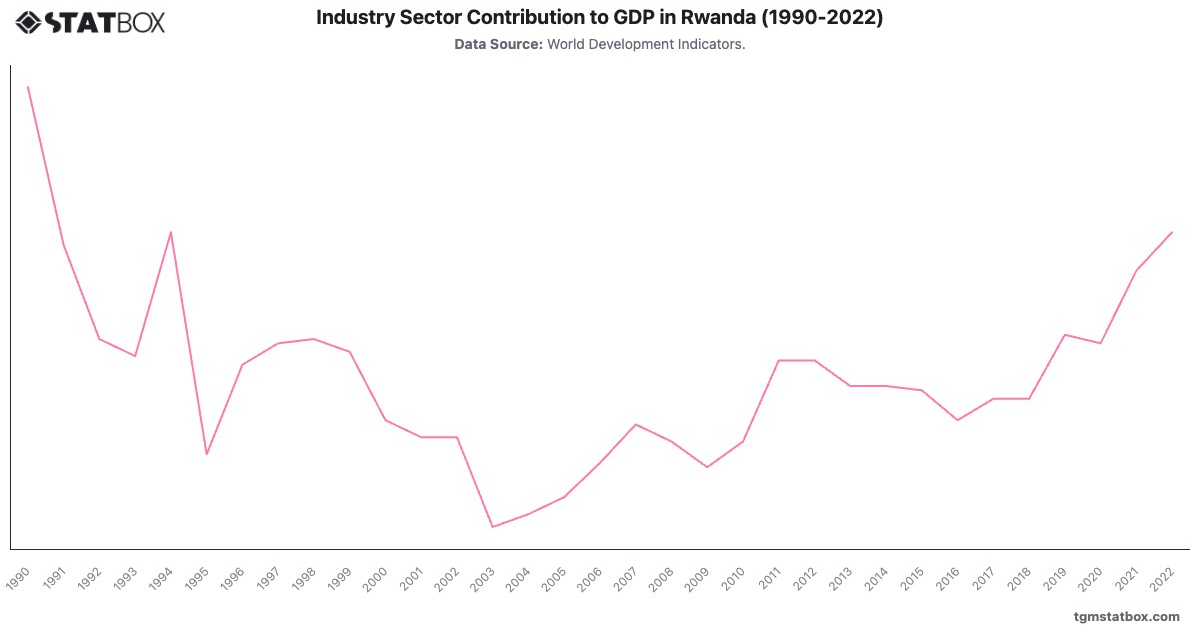
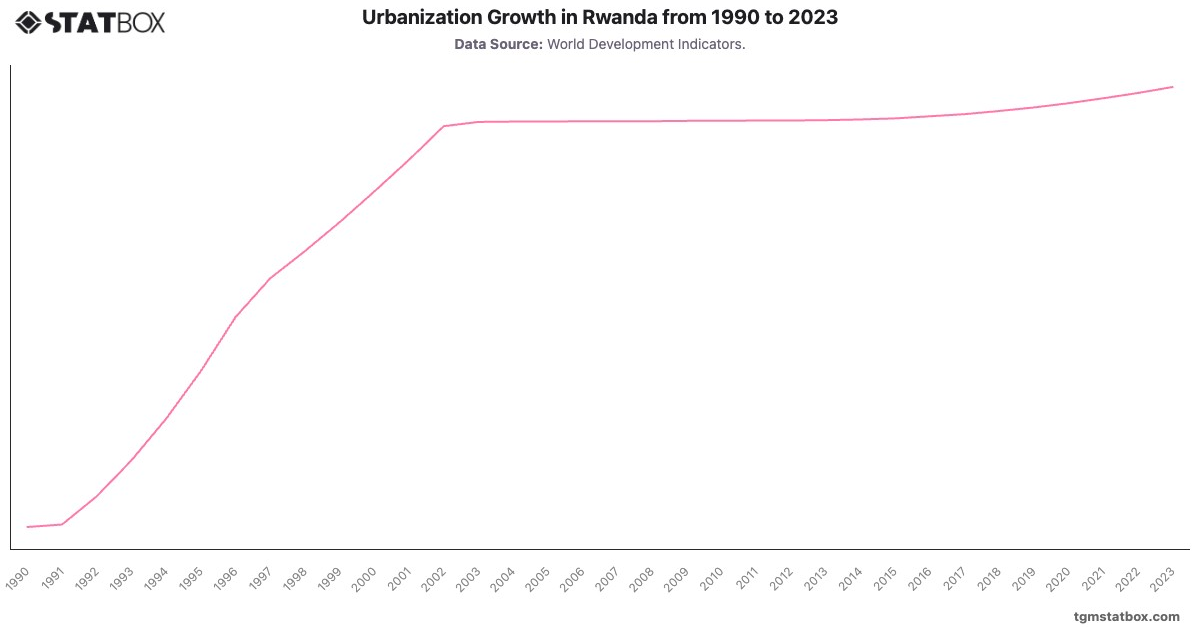
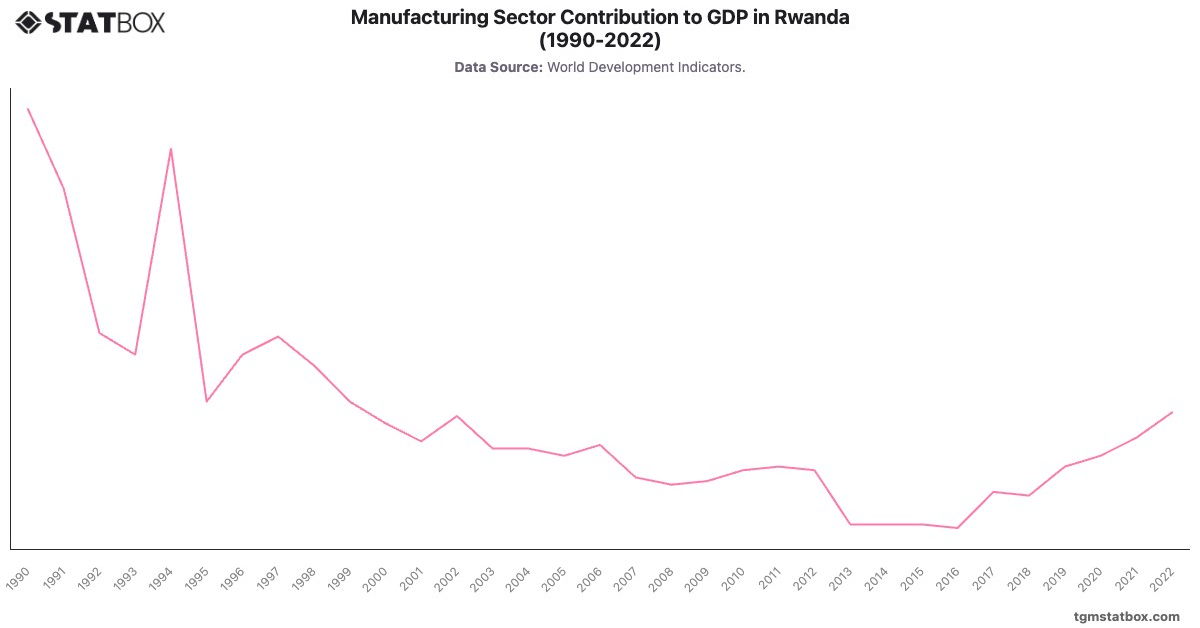
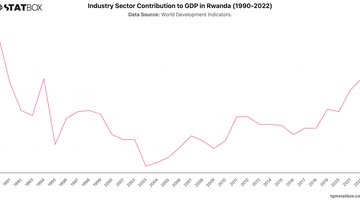
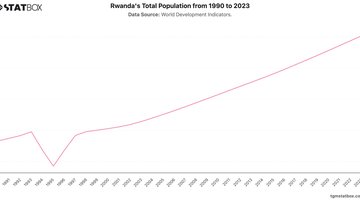
Explore related charts to gain a better understanding of Rwanda’s net lending/borrowing ratio, Rwanda’s industry sector share in GDP, Rwanda’s urban expansion.