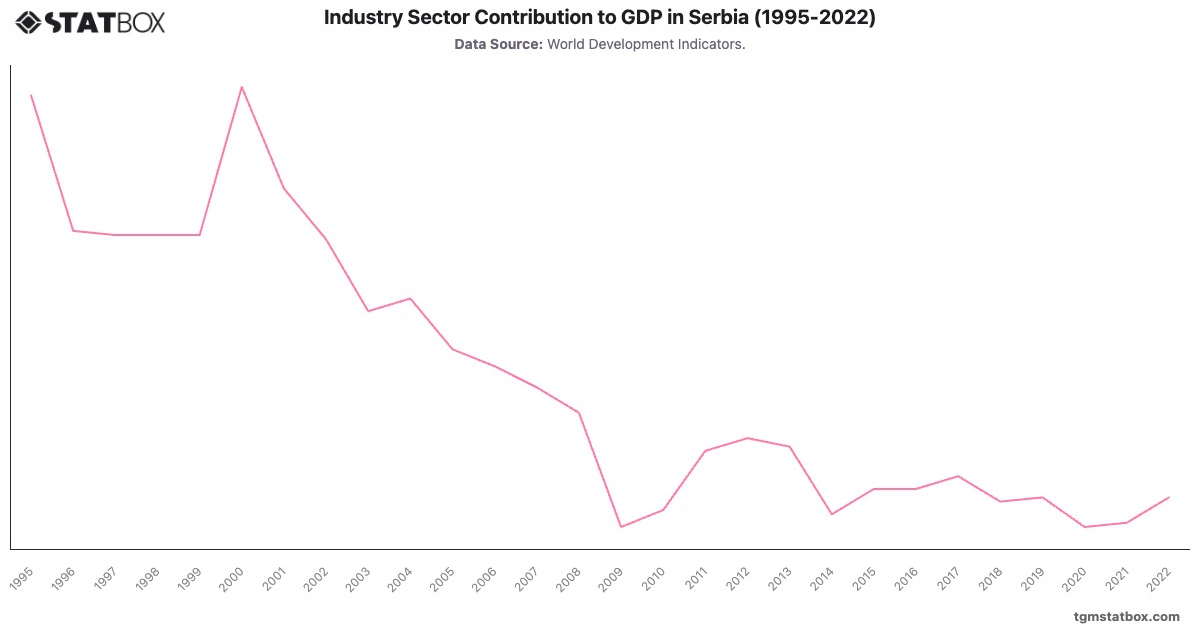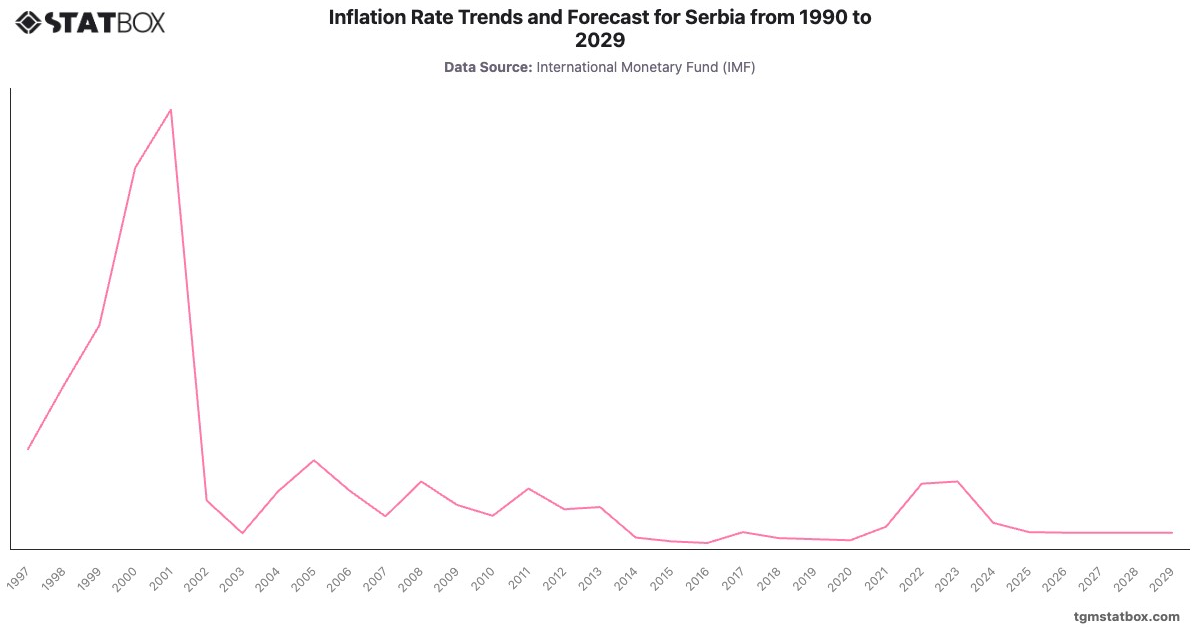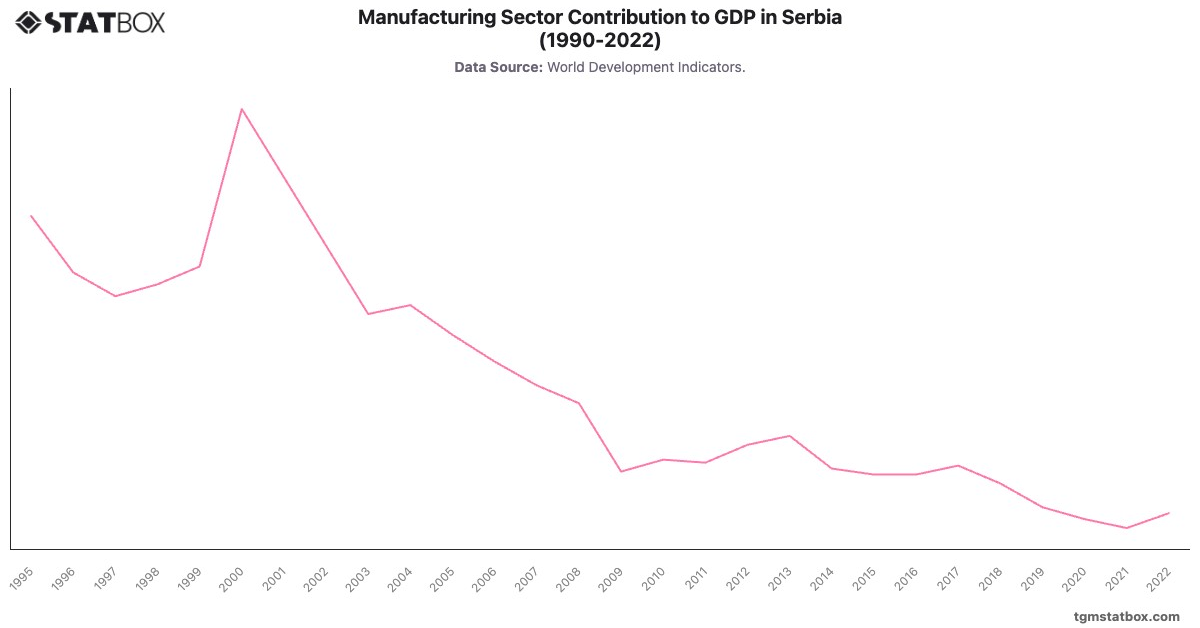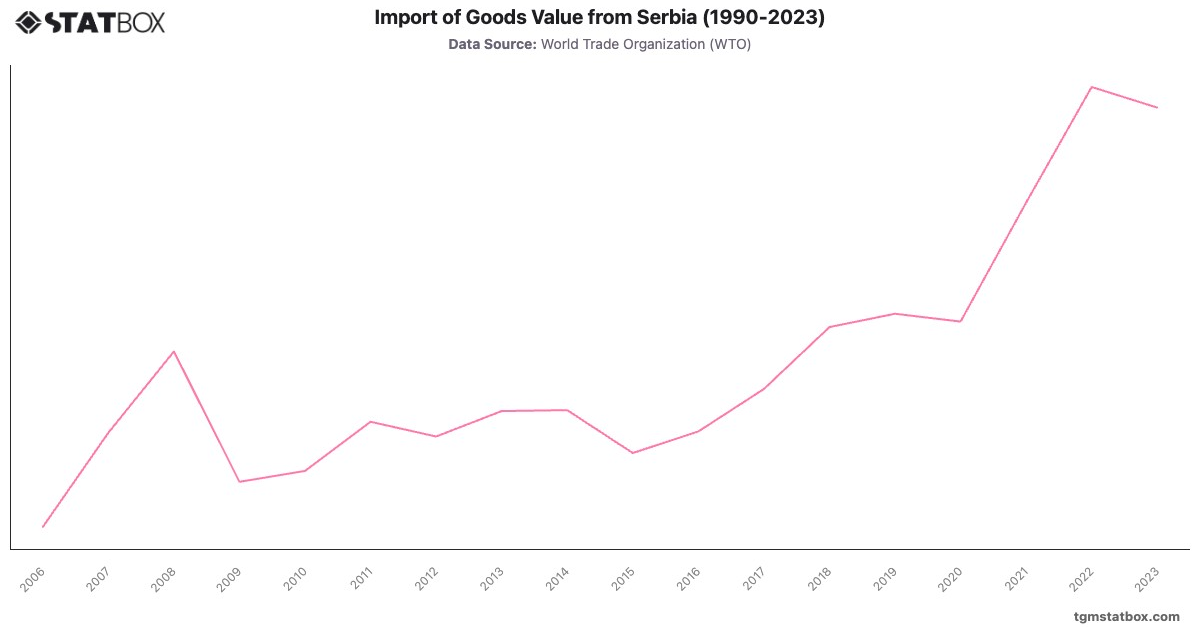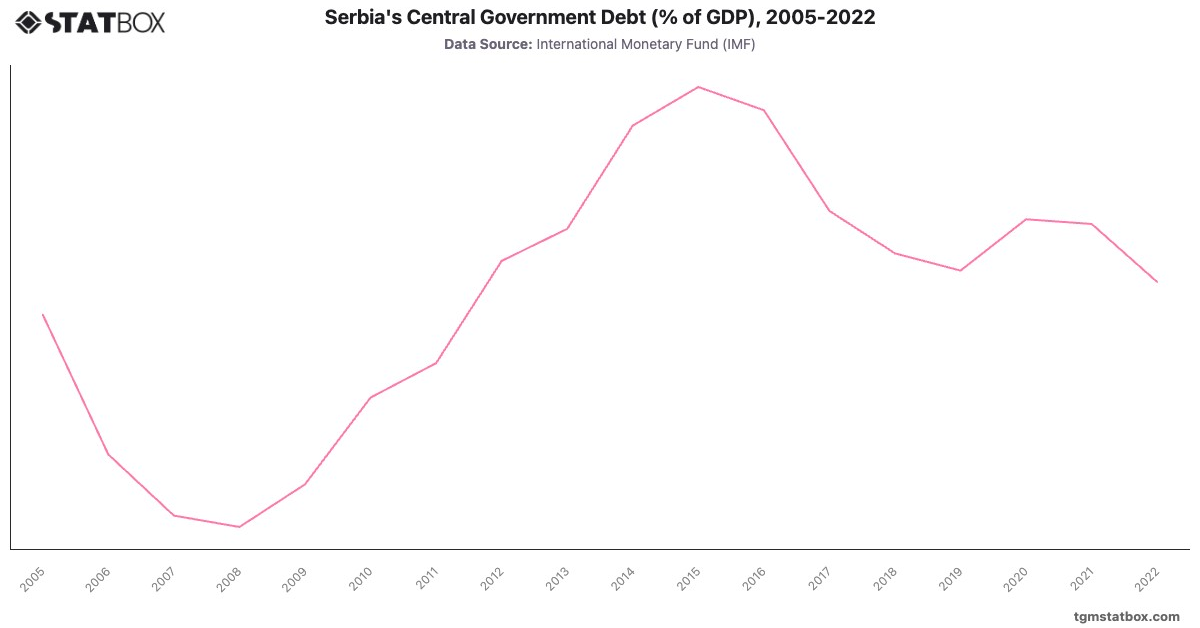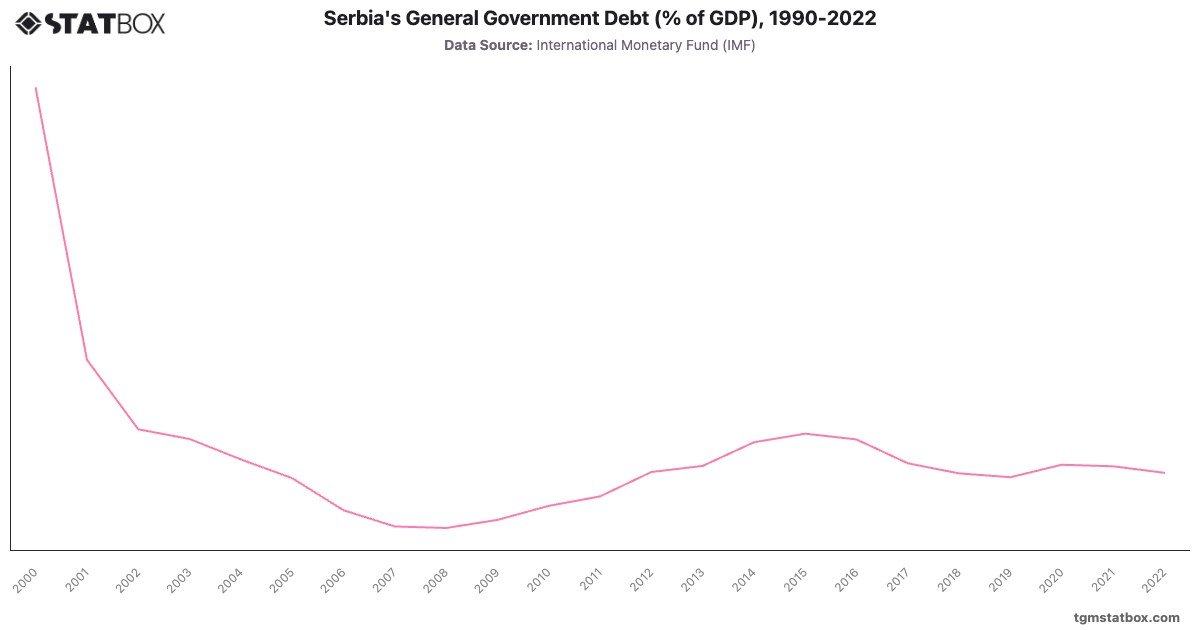
Serbia's general government debt as a percentage of GDP experienced a dramatic decline from 2000 to 2007, starting at a peak of in 2000 and plummeting to by 2007. This sharp decrease reflects economic reforms and debt restructuring efforts, including a series of agreements with the IMF and other financial institutions aimed at stabilizing the economy post-conflict. The early 2000s marked Serbia's transition from hyperinflation and economic isolation to a market economy, reducing its debt-to-GDP ratio significantly.
From 2008 onward, debt levels fluctuated in response to various economic factors, notably rising during the 2008 global financial crisis, reaching in 2014. The effects of the financial crisis and subsequent slow economic recovery contributed to this uptick, with government debt continuing to grow due to increased borrowing needs. However, a period of fiscal consolidation led to reductions post-2016, with debt stabilizing around in 2022, illustrating the country's efforts to maintain fiscal discipline amid regional and global economic challenges.
From 2008 onward, debt levels fluctuated in response to various economic factors, notably rising during the 2008 global financial crisis, reaching in 2014. The effects of the financial crisis and subsequent slow economic recovery contributed to this uptick, with government debt continuing to grow due to increased borrowing needs. However, a period of fiscal consolidation led to reductions post-2016, with debt stabilizing around in 2022, illustrating the country's efforts to maintain fiscal discipline amid regional and global economic challenges.
For a broader context, visit other statistics on Serbia’s annual GDP data, Serbia’s central government debt share in GDP, percentage of military personnel in Serbia.