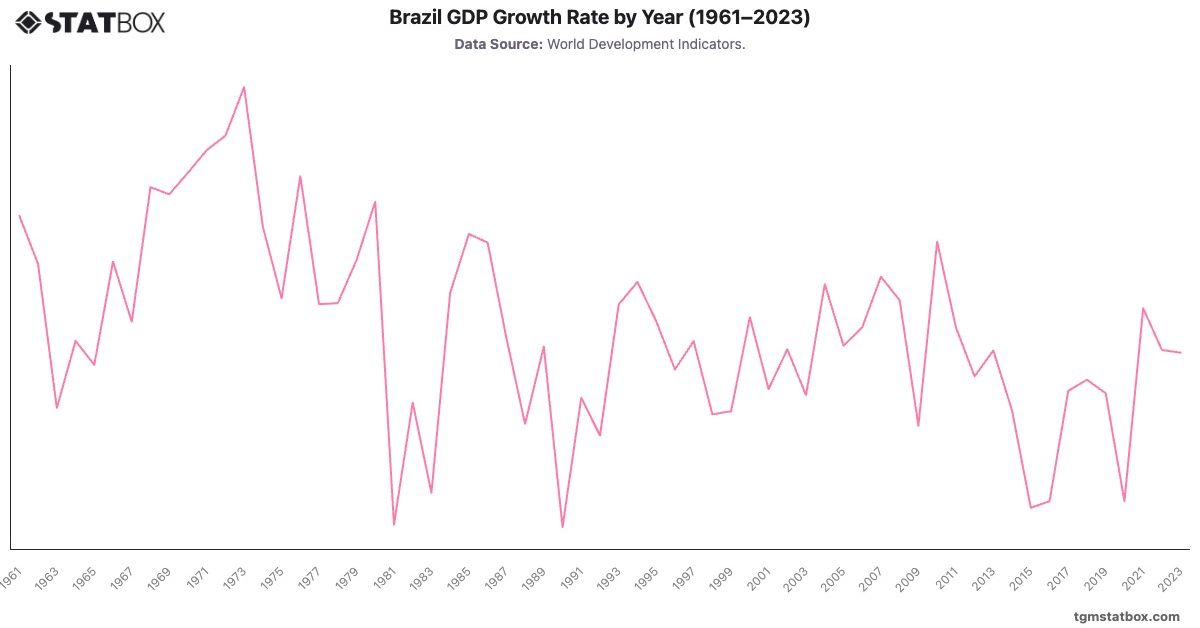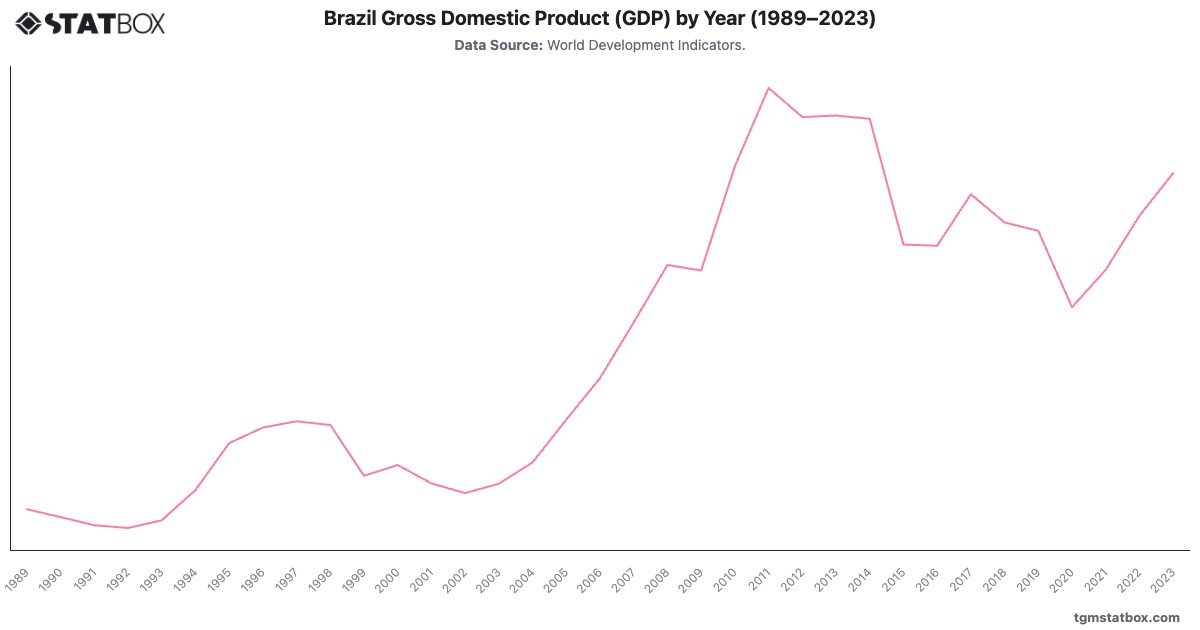
Brazil’s GDP trajectory illustrates a shift from economic volatility to becoming a global economic player. In 1989, GDP stood at $425.6 billion but contracted during the early 1990s due to hyperinflation and policy instability. Stabilization under the Plano Real in 1994 fueled a significant jump to $525.4 billion.
The 2000s marked an economic boom driven by commodities and foreign investments, with GDP peaking at $2.6 trillion in 2011. The recession from 2015–2016 saw GDP shrink to $1.8 trillion. Post-pandemic recovery has been steady, with GDP at $2.17 trillion in 2023, reflecting resilience through structural reforms.
The 2000s marked an economic boom driven by commodities and foreign investments, with GDP peaking at $2.6 trillion in 2011. The recession from 2015–2016 saw GDP shrink to $1.8 trillion. Post-pandemic recovery has been steady, with GDP at $2.17 trillion in 2023, reflecting resilience through structural reforms.
Explore related charts to gain a better understanding of Brazil’s GDP balance estimate, Brazil’s manufacturing sector GDP share, Brazil’s inflation rate forecast.