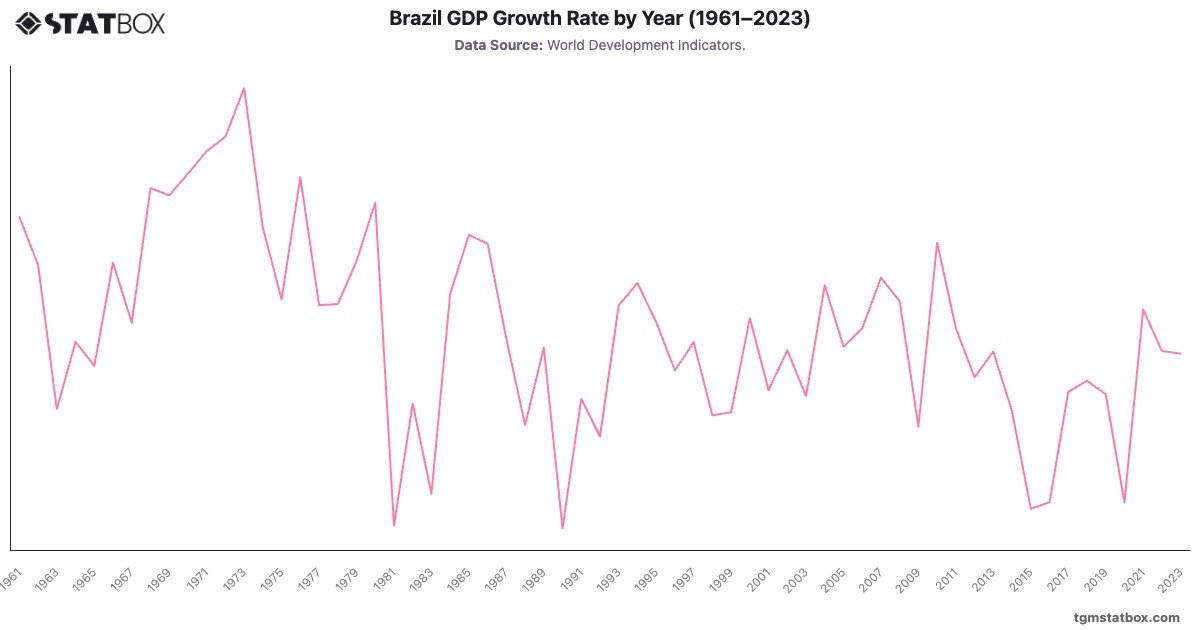
Brazil GDP Growth Rate by Year (1961-2023)
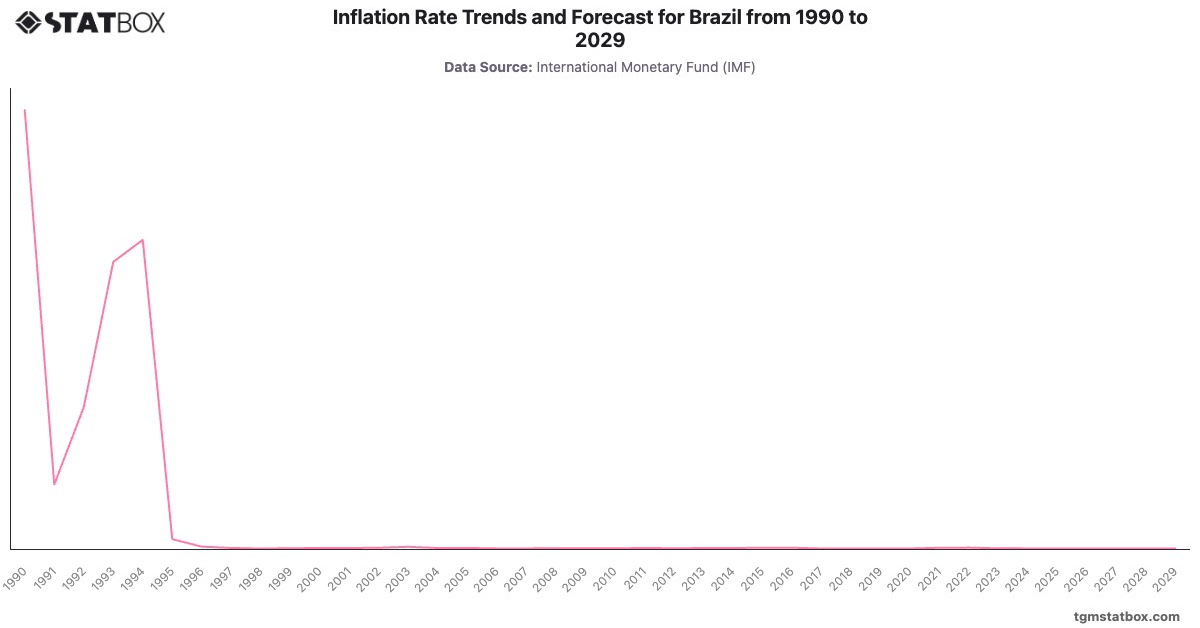
Brazil's economic trajectory has been characterized by phases of rapid growth and deep recessions. The 1960s and early 1970s experienced high growth, peaking at in 1973 due to industrialization. The 1980s, however, were plagued by economic stagnation and high inflation, with GDP contracting by - in 1990. The early 2000s brought about economic stability and growth, peaking at in 2010. Yet, Brazil's economy faced multiple setbacks, including a severe recession in 2015-2016, driven by political turmoil and fiscal challenges. The COVID-19 pandemic led to a contraction of - in 2020, but recovery efforts saw growth rebound to in 2021. The following years showed moderate growth, stabilizing at around in 2023, as economic reforms continued.
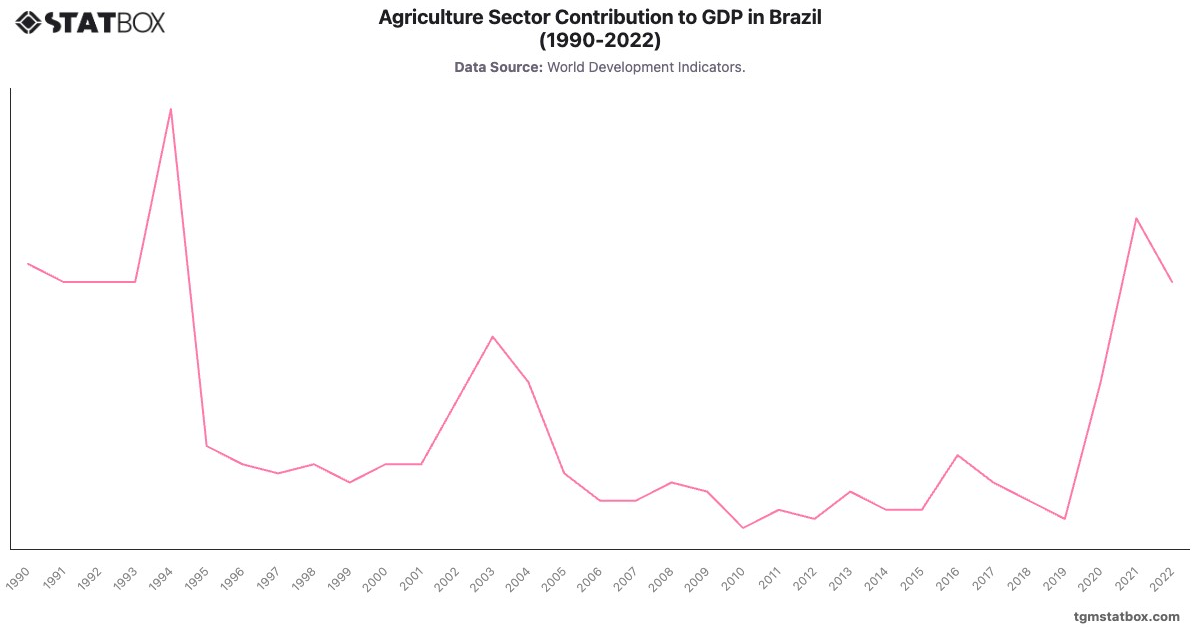
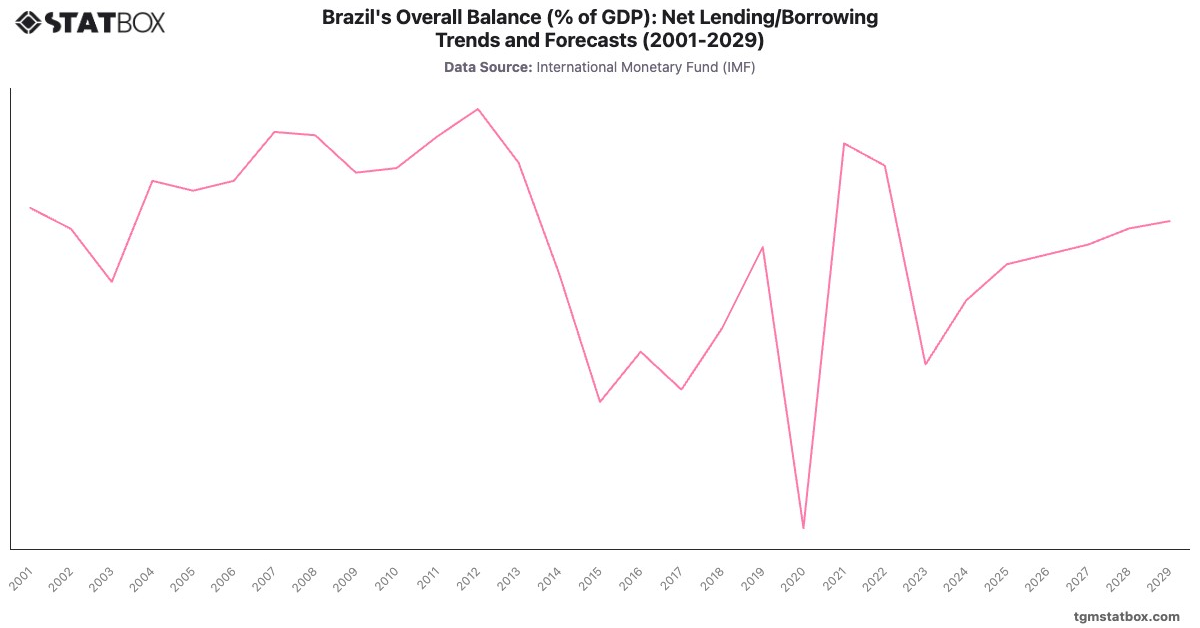
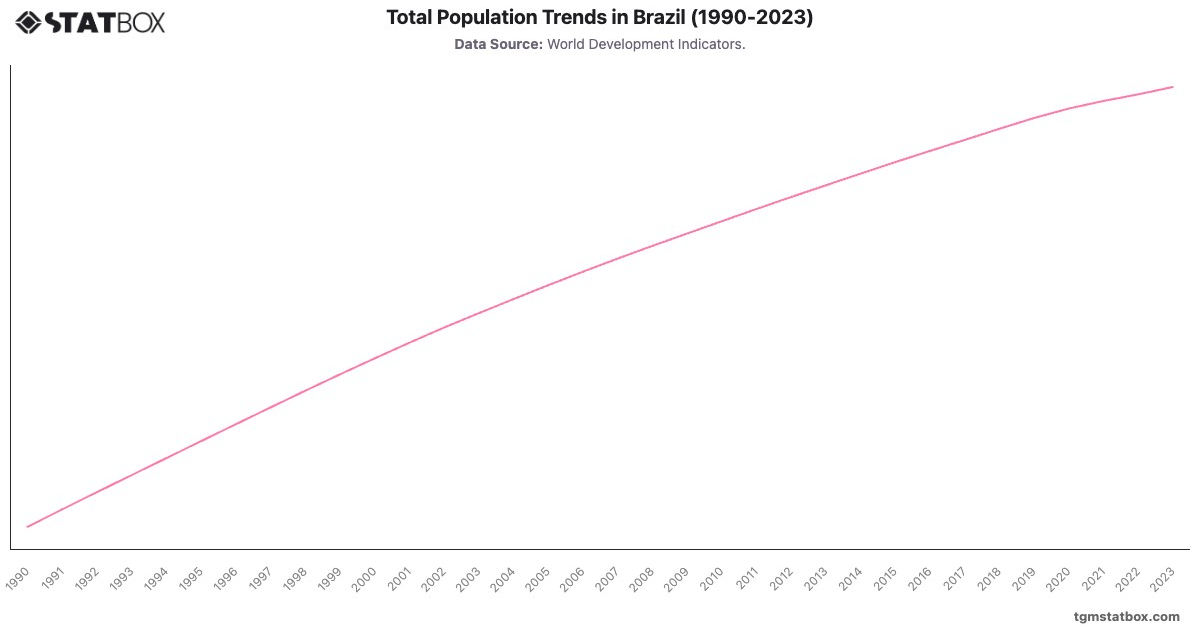
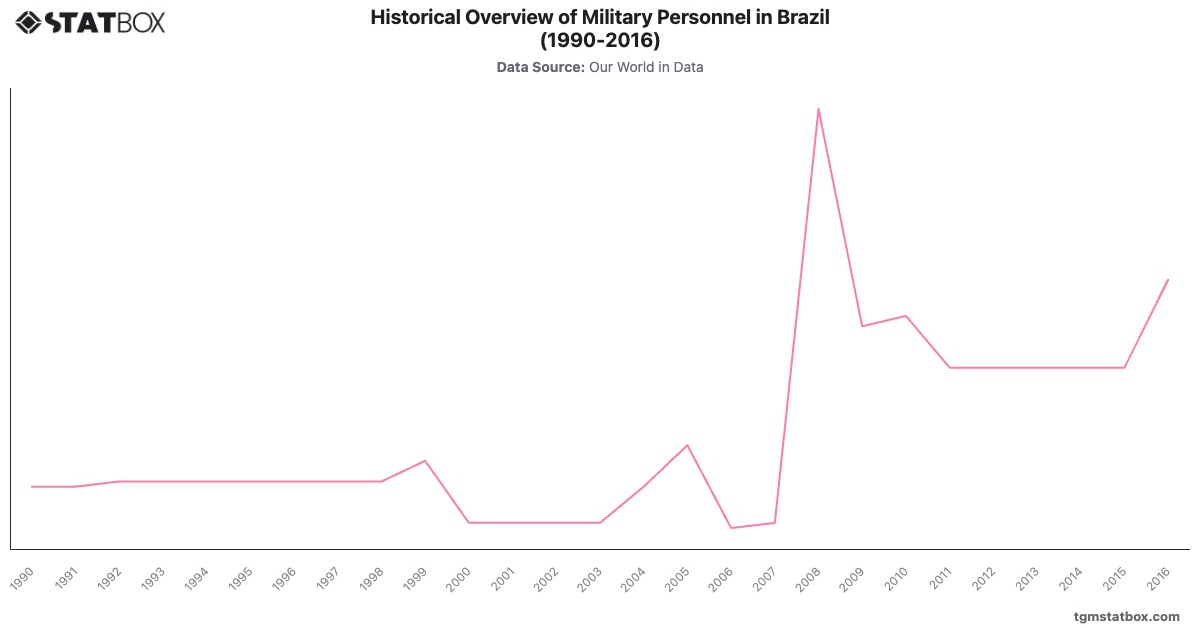
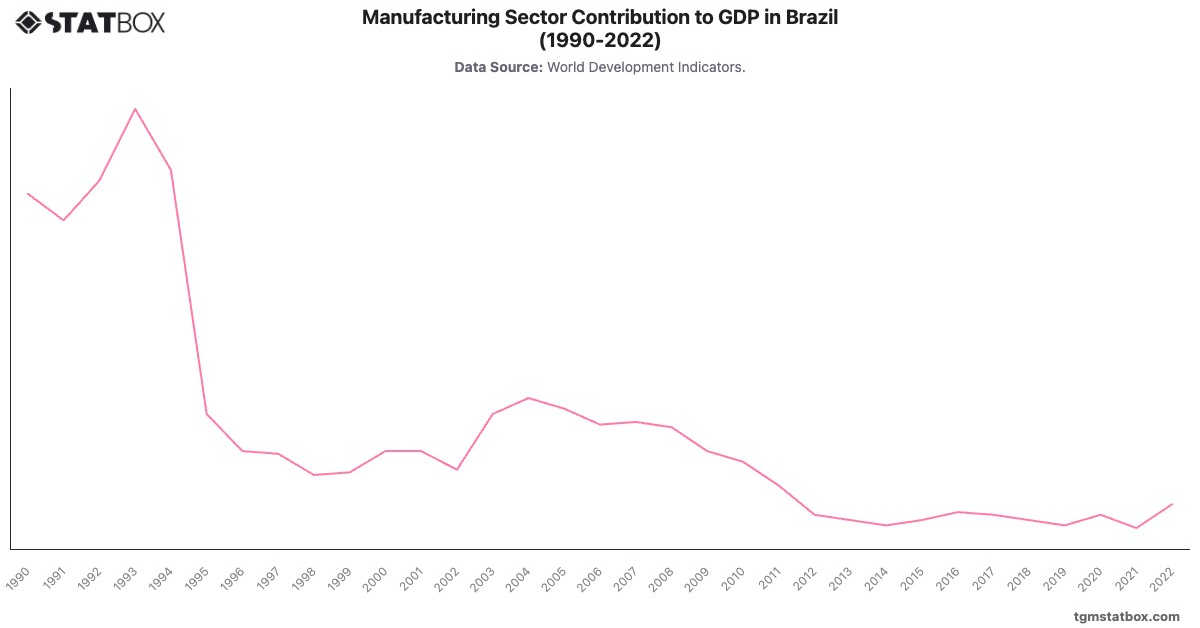
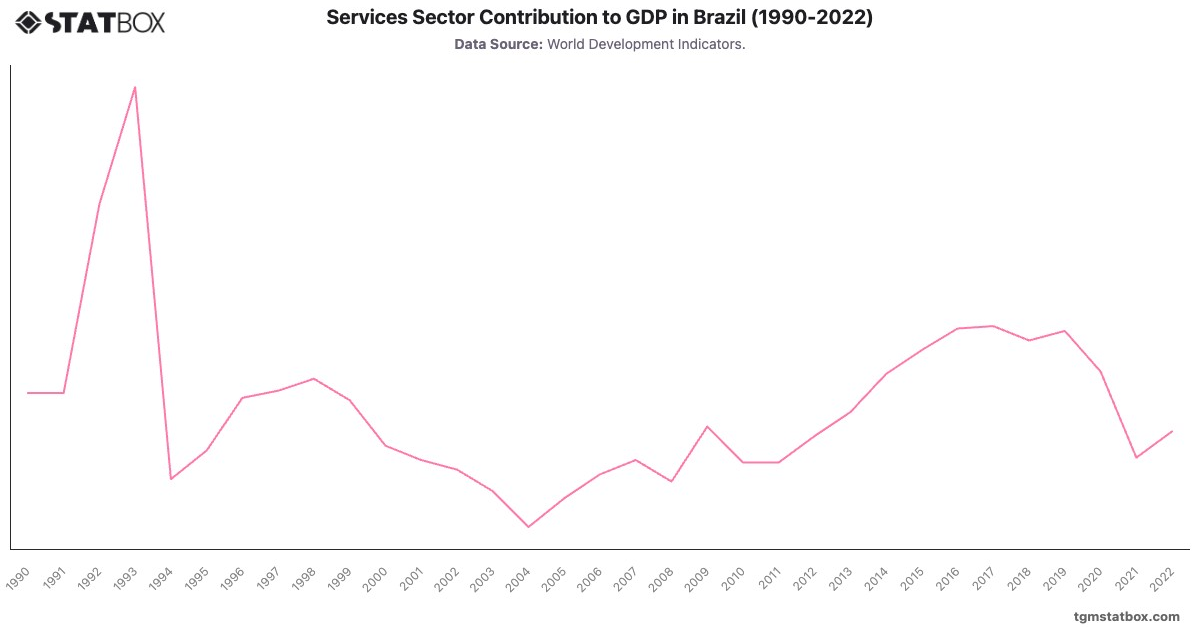
Explore related charts to gain a better understanding of Brazil’s agriculture share in GDP, Brazil’s GDP balance estimate, Brazil’s population trend.