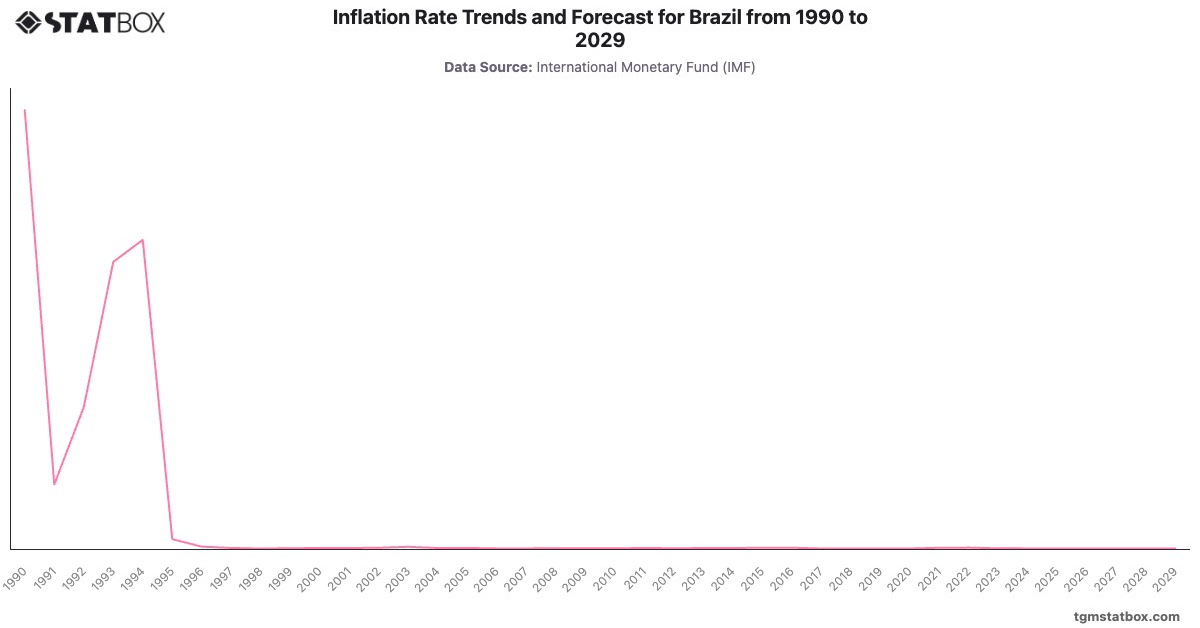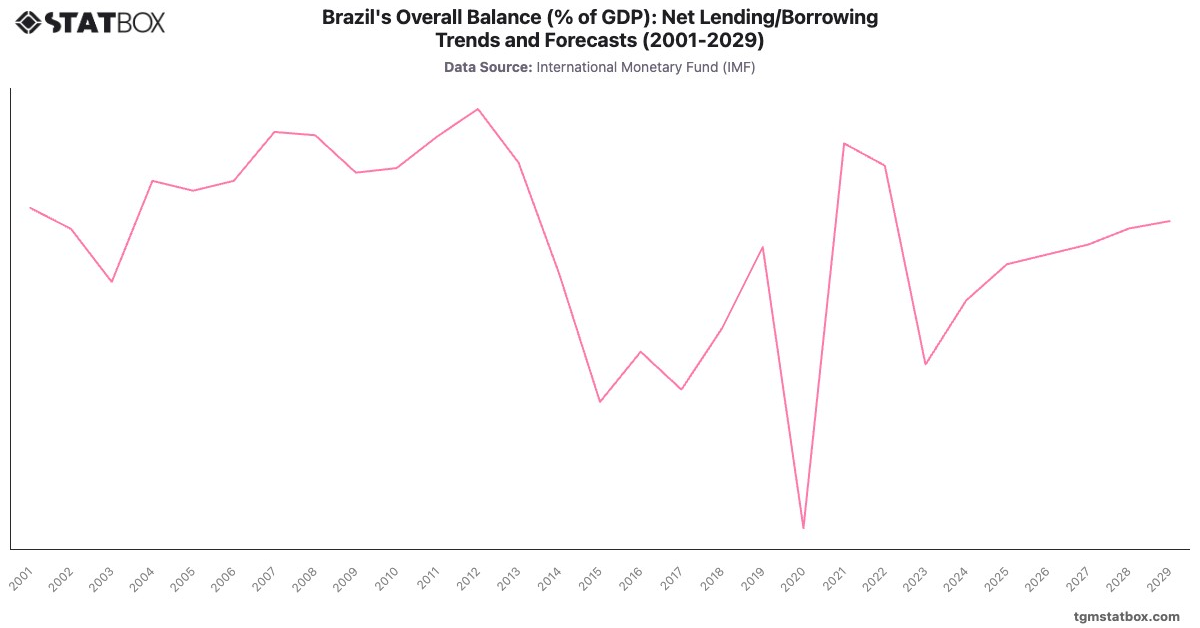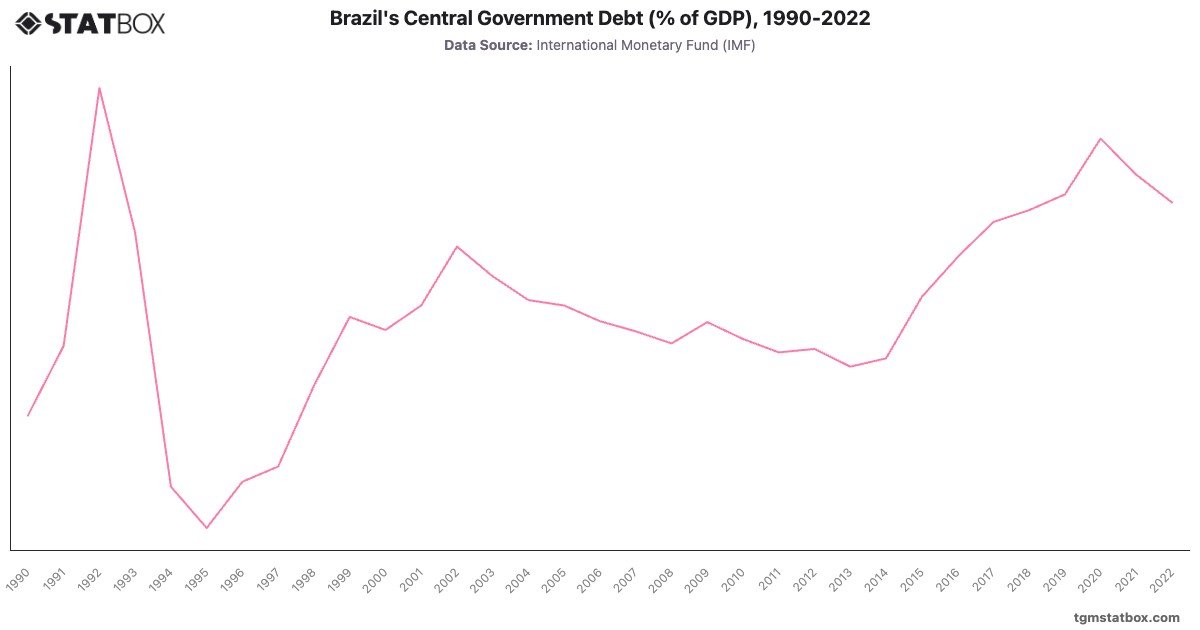
Brazil's debt-to-GDP ratio demonstrated significant volatility between 1990 and 2022. A sharp rise from in 1990 to in 1992 reflects hyperinflation and fiscal challenges. This was followed by a steep decline, reaching in 1995 due to inflation control measures under the Real Plan.
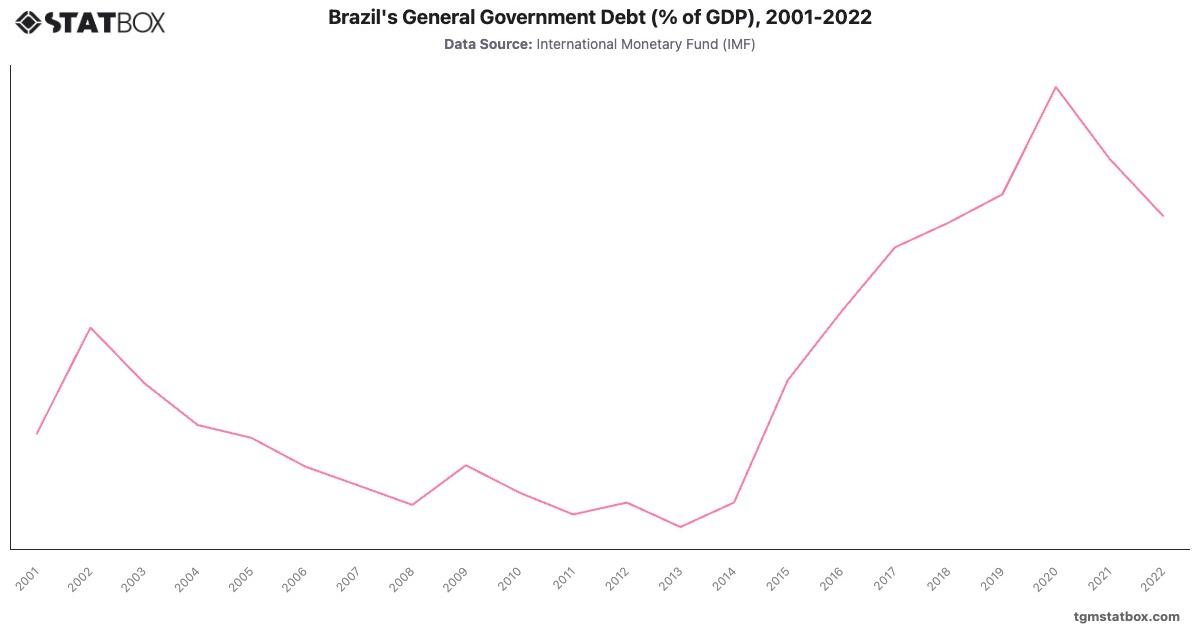
Debt began to climb again in the 2000s, peaking at in 2020, driven by pandemic-related expenditures. By 2022, the ratio declined to , signaling improved fiscal management and a recovering economy, though challenges persist.
Debt began to climb again in the 2000s, peaking at in 2020, driven by pandemic-related expenditures. By 2022, the ratio declined to , signaling improved fiscal management and a recovering economy, though challenges persist.
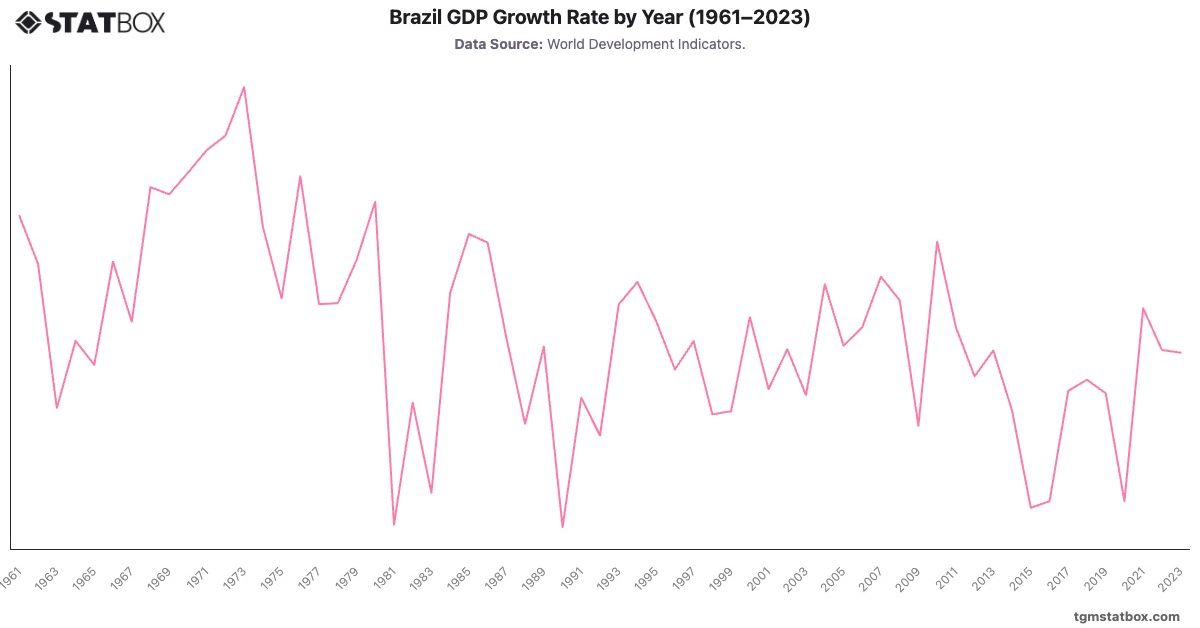
Explore related charts to gain a better understanding of Brazil’s inflation rate forecast, Brazil’s annual GDP growth rate, Brazil’s manufacturing sector GDP share.